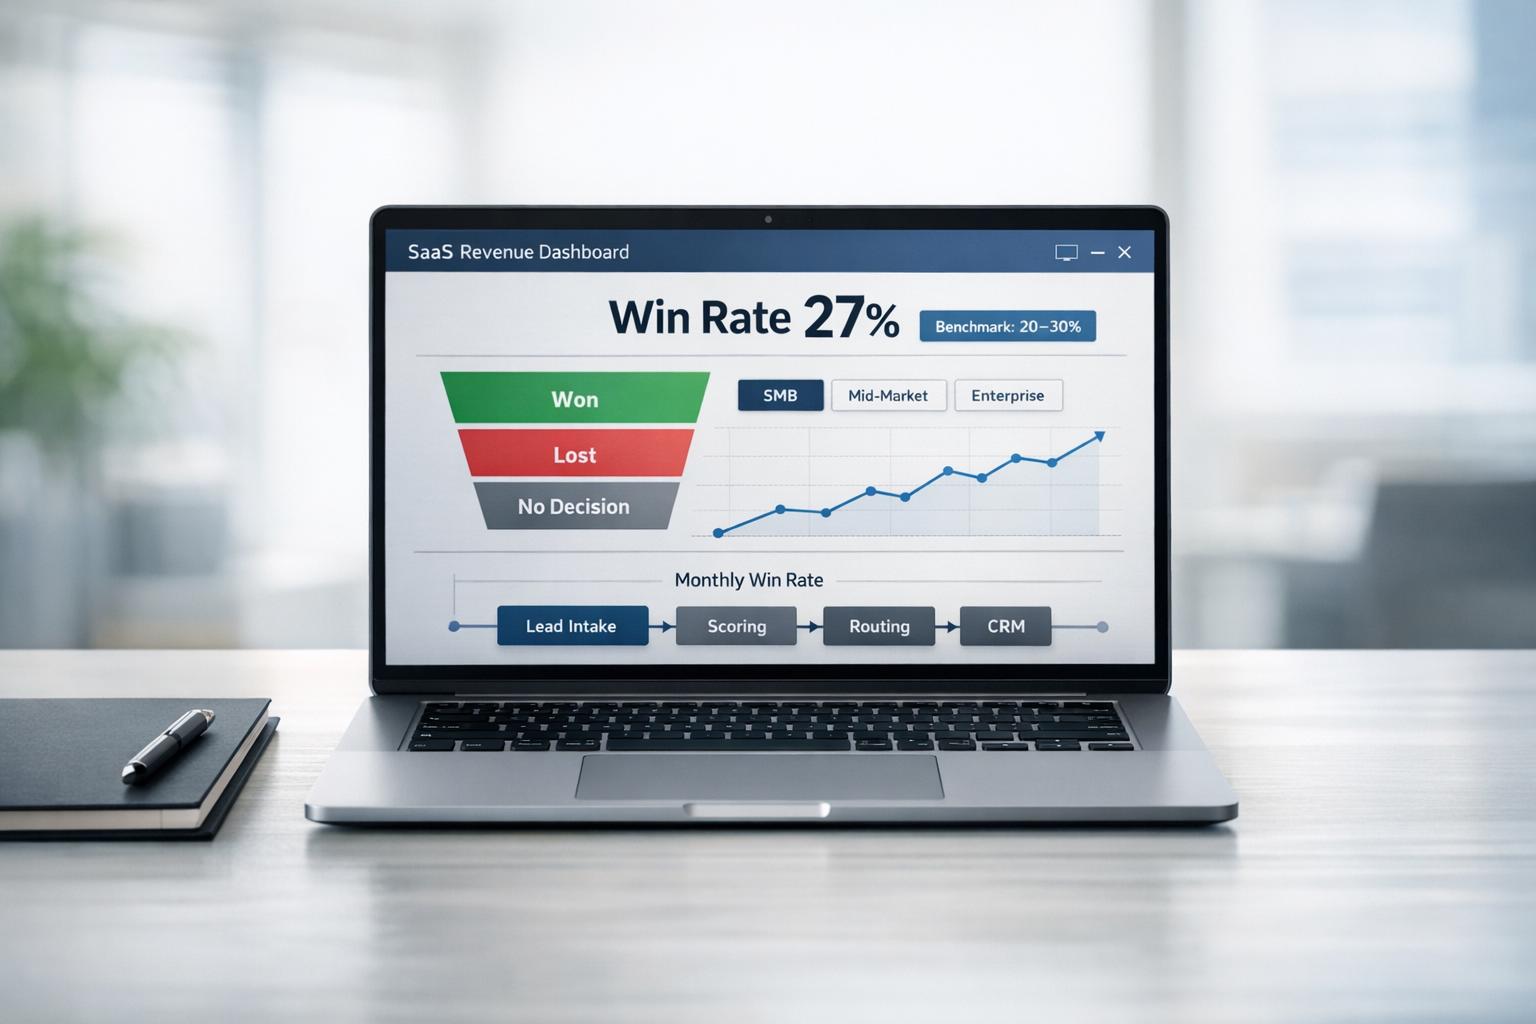
Your win rate tells you how well your sales process converts opportunities into revenue. For B2B startups, especially in SaaS, AI/ML, and fintech, benchmarks typically range between 20–30% for structured outbound strategies. But hitting these numbers isn’t just about effort – it’s about having the right systems in place.
Here’s what you need to know:
- Definition: Win rate = Closed-Won Deals ÷ Total Closed Deals × 100. Always count "no-decision" deals as losses for accurate tracking.
- Key Factors: Deal size, sales cycle length, buyer complexity, and CRM hygiene all impact your win rate.
- Benchmarks:
- SaaS: 20–30% (lower for enterprise deals).
- AI/ML: Often on the lower end due to lengthy proof-of-concept cycles.
- Fintech: Lower and more volatile due to compliance and decision-maker disconnects.
- Improvement Areas:
- Segment win rates by deal size, sales motion, and channel.
- Focus on pipeline hygiene – 45% of sales contacts never make it into CRMs.
- Build automated systems for lead routing, CRM updates, and follow-ups.
Why it matters: A 1% win rate increase can drive significant revenue growth without more headcount or ad spend. Startups that prioritize clean data, segmentation, and infrastructure outperform those that rely on manual processes.
Want to scale smarter? Start by aligning your win rate benchmarks with industry norms and optimizing your sales systems.
How Win Rate Is Defined for B2B Startups
What Is Win Rate?
Win rate represents the percentage of closed deals your team successfully wins. The formula is straightforward:
Win Rate = Closed-Won Deals ÷ Total Closed Deals × 100
Unlike metrics like close rate (which considers all opportunities) or conversion rate (tracking movement between funnel stages), win rate focuses exclusively on deals with a final outcome. Let’s dive into the factors that can skew this measurement.
Factors That Affect Win Rate Measurement
One critical variable in win rate calculation is how you handle "no-decision" outcomes. Roughly 40% of forecasted B2B deals end without a decision. Whether you count these as losses or exclude them entirely can significantly alter your reported win rate.
Another factor is stakeholder complexity. By 2026, the typical B2B deal will involve an average of 5.5 stakeholders. When just one stakeholder stalls the process, it doesn’t always mean the deal is lost. However, if your CRM lacks the necessary granularity, such situations may be misclassified, leading to inaccurate win rate data.
Let’s look at how to standardize win rate calculations for reliable comparisons.
How to Standardize Win Rate for Benchmarking
To benchmark effectively, you need to measure win rate in line with industry norms. Most benchmarks define win rate as the percentage of closed-won deals out of total closed deals, counting no-decision outcomes as losses. If your team excludes stalled deals, your win rate will appear inflated compared to industry standards.
Consistency in metrics is essential for aligning your revenue operations and planning your pipeline effectively.
"A broken CRM is worse than no CRM. It destroys team morale and makes data-driven decisions impossible." – GTM Engineer Case Studies
To ensure consistency, establish a clear, shared definition of win rate across your team. Automate CRM stage progression based on real deal activity to reduce manual errors, and regularly audit your data. Remember, CRM contact data decays at a rate of 25–30% annually, and outdated records can quietly distort your win rate over time.
B2B Win Rate Benchmarks Across Industries
Average B2B Win Rates
When examining B2B industries, win rates generally hover between 20–30% for teams leveraging structured, data-driven outbound strategies. However, these rates can vary widely depending on factors like how precisely targets are identified, the effectiveness of follow-up sequences, and the level of buyer engagement.
Teams relying on broad, generic cold outreach often see reply rates as low as 3–5%, which naturally limits the number of deals progressing to advanced stages. On the other hand, companies that adopt signal-based targeting – monitoring indicators such as funding events, hiring trends, or changes in technology stacks – report win rates nearing 40% for qualified opportunities. For example, one Series B Sales Enablement SaaS company transitioned from a manual SDR approach to an automated, signal-triggered system. As a result, they maintained a 40% win rate on qualified opportunities while consistently generating 40–60 qualified meetings per month at an 18% reply rate.
In contrast, professional services firms typically report lower conversion rates, averaging around 12% on qualified opportunities. This discrepancy often stems from the relationship-driven nature of their sales process, which is less conducive to automation and standardization.
How Deal Size and Sales Cycle Length Affect Win Rate
Larger deals, especially those with annual contract values (ACVs) exceeding $50,000, tend to have lower win rates. This is largely due to the involvement of larger buying committees, which typically include 4–7 stakeholders. Each additional decision-maker introduces more complexity and increases the chances of a deal stalling. Additionally, the person responding to initial outreach is often not the one authorized to finalize the contract.
For deals with sales cycles lasting 6–12 months, particularly those sourced through outbound efforts, the risk of losing momentum is significant without well-coordinated follow-ups by account executives (AEs). This challenge is especially pronounced for high-value deals, as rising customer acquisition costs – up 14% year-over-year as of 2026 – make every lost deal harder and more expensive to replace.
"6–12 month sales cycles where outbound-sourced deals go cold if sequences aren’t coordinated with the AE’s follow-up cadence." – Astra GTM
Context matters when evaluating win rates. A 25% win rate on deals with a $10,000 ACV paints a very different picture than the same rate on $100,000 ACV deals. Understanding these variables – deal size, sales cycle length, and industry norms – is essential for setting realistic and meaningful benchmarks across different sales environments.
Win Rate Benchmarks by Vertical: SaaS, AI/ML, and Fintech
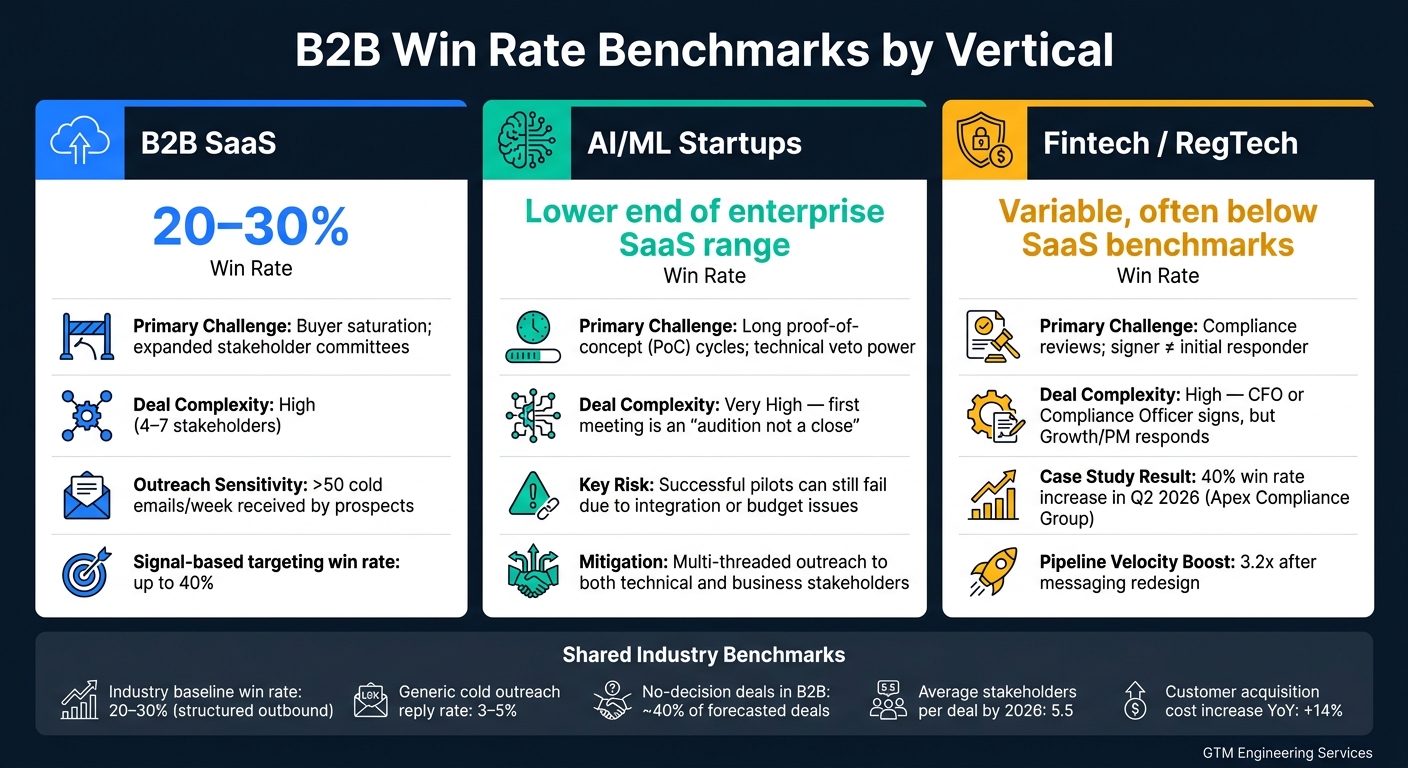
B2B Win Rate Benchmarks by Vertical: SaaS, AI/ML & Fintech
Vertical-specific benchmarks highlight distinct hurdles and opportunities, complementing the broader win rate metrics discussed earlier.
SaaS Startups
SaaS companies typically see win rates in the 20–30% range, though this varies significantly with deal complexity. Enterprise SaaS deals, characterized by higher ACVs and prolonged evaluation periods, often sit at the lower end – or even below this range.
One major obstacle is buyer saturation. With prospects receiving over 50 cold emails per week, generic outreach is quickly dismissed. The challenge intensifies with expanded buying committees, as each stakeholder brings unique priorities and objections. Technical evaluators, such as senior engineers or CTOs, frequently hold veto power – if the product doesn’t integrate seamlessly into their existing tech stack, the deal is likely to fall through, regardless of the budget holder’s approval.
AI/ML Startups
Win rate data for AI/ML startups is less comprehensive than for general SaaS, but available benchmarks align with the lower end of enterprise SaaS ranges. This is largely due to how these deals are structured: the initial meeting often serves as a test rather than a sales opportunity.
"Proof-of-concept expectations mean your first meeting isn’t a close – it’s an audition." – Astra GTM
Lengthy proof-of-concept (PoC) cycles frequently delay decision-making. Even a technically successful pilot can falter later due to integration issues or budget constraints. To counter this, multi-threaded outreach – targeting both technical evaluators and business stakeholders with tailored messaging – has proven to be one of the few effective strategies to prevent deals from stalling during extended evaluation periods.
Fintech Startups
Fintech and RegTech startups report win rates that are not only lower but also more volatile compared to general SaaS. Compliance checks, security audits, and regulatory challenges often derail deals, even after verbal agreements have been made.
The issue is compounded by a mismatch between the initial point of contact and the ultimate decision-maker. For instance, outreach often engages growth leads or product managers, while the final contract is typically signed by a CFO or Compliance Officer. This disconnect necessitates intentional multi-threaded outreach from the outset. Apex Compliance Group, a RegTech SaaS company, tackled this by redesigning its messaging to focus on competitor weaknesses and pain-point-driven copy. The result? A 40% increase in win rate during Q2 2026, alongside an 18% reply rate and a 3.2x boost in pipeline velocity.
"They reverse-engineered our competitor’s positioning gaps and built messaging that positioned us as the only logical choice. Win rate increased 40% in Q2 alone." – James Morrison, Chief Commercial Officer, Apex Compliance Group
These benchmarks provide a clearer picture of the external challenges different verticals face, setting the stage for examining internal factors that influence win rates.
| Vertical | Typical Win Rate | Primary Challenge |
|---|---|---|
| B2B SaaS | 20–30% | Buyer saturation; expanded stakeholder committees |
| AI/ML | Enterprise-aligned (lower end) | Long PoC cycles; technical veto power |
| Fintech / RegTech | Variable (often below SaaS) | Compliance reviews; signer ≠ responder |
Internal Factors That Drive Win Rate at Funded B2B Startups
Focusing on segmentation, pipeline hygiene, and revenue infrastructure can reveal actionable insights to improve win rates.
Segmenting Win Rate for Clearer Insights
Using a single, company-wide win rate often masks critical details. Breaking it down by channel (like inbound vs. outbound), motion (new logo vs. expansion), and deal size uncovers patterns that lead to better strategies.
Take deal size, for example: larger deals ($50K+ ACV) need highly personalized outreach aimed at a narrow list of 50–100 accounts. Smaller deals ($5K–$15K ACV), on the other hand, can be handled with semi-personalized templates targeting 500–1,000 contacts. Applying the same approach across all deal sizes can dilute your overall win rate.
Segmentation also helps identify "negative cases" – accounts that look promising on paper but consistently fail to close or churn quickly. These patterns often surface only when analyzing closed-won and closed-lost deals across factors like growth rate, tech stack, and buying committee size.
"Going from ‘these 5,000 accounts match our ICP’ to ‘these 500 ICP accounts are showing buying signals right now’ is the difference between fishing in the right ocean and fishing in the right spot." – JA Westenberg
Pipeline Hygiene and Sales Process
Segmentation insights are only as good as the data supporting them. A clean, well-maintained pipeline ensures your win rate reflects actual sales performance. When deals are misclassified, contacts go unlogged, or inactive opportunities clutter the CRM, metrics become unreliable, and forecasting accuracy drops. Without clean data and AI tools, forecast accuracy hovers around 45–55%.
The problem is widespread: 45% of sales contacts never make it into CRM systems, and B2B contact data deteriorates at an annual rate of 30–70%. On top of that, sales reps spend roughly 70% of their week on tasks unrelated to selling, making manual data management impractical.
Automation is the solution. Capturing activity signals like email opens or call logs and implementing real-time enrichment tools (e.g., Apollo, Clay, ZoomInfo) ensures accurate records without adding to your team’s workload.
How Revenue Infrastructure Affects Win Rate
Strong revenue infrastructure complements pipeline hygiene, ensuring leads are routed to the right reps at the right time. Automated systems handle lead scoring, routing, deduplication, and deal health monitoring, preventing critical information from slipping through the cracks.
For instance, a Series A SaaS company overhauled its Salesforce CRM in 2026, eliminating over 2,000 duplicate records and boosting email deliverability from 65% to 95%. By integrating Apollo and Salesloft and automating workflows, the company cut its average deal cycle from 45 days to 28 days.
This type of transformation is where GTM Engineering Services excels – building automated revenue systems that maintain clean pipeline data, route high-intent leads instantly, and provide teams with the visibility they need to coach deals and forecast accurately. For Series A and Series B startups, establishing scalable go-to-market systems is essential.
"The answer isn’t more headcount. It’s better infrastructure." – GTM Engineering Services
Using Win Rate Benchmarks in Pipeline Planning and Revenue Operations
Once you’ve got clean, segmented win rate data, it’s time to put it to work – whether that’s setting pipeline targets, building dashboards, or refining your forecasting models.
Applying Benchmarks to Pipeline Planning
To calculate how much pipeline you need, divide your revenue target by your win rate. For example, if your goal is $1,000,000 and your win rate is 20%, you’ll need $5,000,000 in pipeline to hit that target.
It’s important to adjust this calculation based on your sales motion and deal size. For instance, outbound-sourced deals in B2B SaaS often have sales cycles lasting 6–12 months. This means the pipeline you’re building today might not close until next year. Ignoring cycle length can lead to overestimating short-term revenue potential. Using segmented win rate data ensures your calculations reflect actual performance rather than relying on blended averages. These precise pipeline requirements also lay the groundwork for dashboards that highlight performance trends.
Building Win Rate Dashboards
A well-designed win rate dashboard should break down performance by factors like sales motion, deal size, and cycle length. Tracking win rates separately for inbound versus outbound sales, different deal sizes, and varying cycle lengths helps reveal which areas are performing well and which need more focus.
Another critical component is full-path revenue attribution. By mapping the journey from the first outbound touch to closed-won ARR, you can see which channels and actions are genuinely driving results – not just generating activity. However, achieving this level of insight depends on high-quality CRM data. Automated systems can boost CRM accuracy from 40% to 95%, ensuring your dashboards are built on reliable data. Without clean inputs, even the most sophisticated win rate metrics can lead you astray.
"The biggest win wasn’t just volume – it was visibility. Once infrastructure was in place, the founder could see exactly where meetings came from, what messaging worked, and how to replicate success." – GTM11 Case Study
This kind of granular visibility is essential for determining how much pipeline coverage you need.
Calculating Pipeline Coverage Multiples
Pipeline coverage multiples translate your win rate into actionable pipeline targets. A 3–5x coverage multiple is typical for most B2B startups. The multiple you need depends on your win rate – 33% win rates align with a 3x multiple, while a 20% win rate requires 5x. Start with industry benchmarks for your sector, and then refine the multiple as your historical data grows.
Here’s a key detail: avoid applying a single coverage multiple across the board. Enterprise and mid-market deals close at different rates, so they require different pipeline depths. Segmented coverage targets ensure you don’t overallocate resources where conversion rates are already high – or underallocate where they’re lower. Accurate, segmented win rate data makes this level of precision achievable. For Series A and Series B startups, GTM Engineering Services can help design the analytics and dashboards needed to achieve this precision right from the start.
Conclusion: Putting Win Rate Benchmarks to Work
Win rate benchmarks act as a health check for your sales process. If your win rate drops significantly below industry norms, it’s often a sign of deeper issues – whether that’s misaligned targeting, unclear messaging, clunky handoffs, or messy CRM data.
The first step? Get your data in order. Break down win rates by deal size and sales motion, and use those insights to set realistic pipeline targets. Aggregated win rates can hide specific channel weaknesses, but companies that consistently hit or surpass benchmarks have systems in place to uncover and address these gaps. Strong revenue infrastructure isn’t just a nice-to-have – it’s what makes scalable go-to-market operations possible.
Here’s a telling stat: sales reps spend as much as 21% of their time on manual data entry instead of selling. That’s not a productivity issue – it’s a systems problem. This kind of inefficiency drags down win rates by slowing response times, cluttering CRM data, and pulling reps away from what they do best: closing deals.
Industry leaders are already looking ahead:
"The winning GTM teams of 2026 and beyond will be those that set clear boundaries for the role of human-AI collaboration: where AI takes care of volume, consistency, and pattern recognition, while humans take care of the relationship, judgment, and strategy." – Ankit Patel, CEO, Wappnet
For startups navigating the leap from founder-led sales to scalable revenue operations, the key isn’t just hiring more people – it’s building the right systems. GTM Engineering Services specializes in creating that infrastructure, from automated lead intelligence to CRM workflows and actionable pipeline dashboards. If your current setup feels unclear or clunky, their free 30-minute GTM Stack Audit is a smart place to start. Use these benchmarks to sharpen your pipeline and set the stage for growth.
FAQs
What win rate should my startup target right now?
For B2B startups, success hinges on two critical factors: the precision of your targeting and the effectiveness of your revenue systems. Forget chasing generic benchmarks – what sets top-performing teams apart is their ability to harness intent data to zero in on high-intent prospects. The results can be game-changing, with some teams achieving opportunity creation rates as high as 62% from qualified meetings.
This is where GTM Engineering Services comes into play. They design automated systems that not only identify these high-potential accounts but also create a pipeline that’s both predictable and scalable. It’s about replacing guesswork with data-driven strategies that deliver results.
How should we count “no-decision” deals in win rate?
To get a true sense of your win rates, it’s crucial to count "no-decision" deals as losses instead of leaving them out. This gives you a more honest look at your pipeline and avoids artificially boosting your numbers. GTM Engineering Services suggests leveraging pipeline analytics and CRM automation to track these outcomes. This helps you differentiate between deals lost to competitors and those that simply stalled. With this insight, you can fine-tune your outreach strategies and sharpen your ICP targeting, paving the way for steadier revenue growth.
What’s the fastest way to improve win rate without hiring?
The fastest way to increase win rates without hiring more people is by building automated revenue systems. By swapping out manual tasks for tools like signal-based targeting, AI-driven personalization, and CRM automation, you can zero in on high-intent prospects and cut down on inefficiencies.
GTM Engineering Services supports funded B2B startups in fine-tuning their go-to-market tech stack. The result? A predictable pipeline and better conversion rates – all without growing your team.