Pipeline velocity measures how quickly your startup converts leads into revenue, making it a critical metric for Series A success. With 40% of post-funding startups failing due to inefficient sales processes, building a scalable revenue engine is essential for securing Series B funding. Here’s what you need to focus on:
- Lead Quality: Use signal-based targeting to identify high-conversion opportunities. Automate lead sourcing and enrichment to save time and boost reply rates (4%-8% vs. 1%-2% for cold lists).
- Deal Qualification: Apply frameworks like ICP 2.0 to filter leads by urgency, timing, and decision-making structure. Focus on companies with clear buying triggers.
- Pipeline Structure: Define clear stages (e.g., MQL to SQL) with specific entry/exit criteria. Assign single owners to deals to improve accountability and progression.
- Velocity Metrics: Track sales velocity using the formula: (Qualified Opportunities × Win Rate × Deal Size) ÷ Sales Cycle Length. Identify bottlenecks and fix drop-off points to keep deals moving.
- Automation: Use tools to reduce manual tasks, like CRM updates and follow-ups, freeing your team to focus on selling.
Key takeaway: Investors prioritize startups with scalable, repeatable sales systems. By improving lead quality, deal qualification, and pipeline efficiency, you can increase pipeline velocity and secure the next funding round.
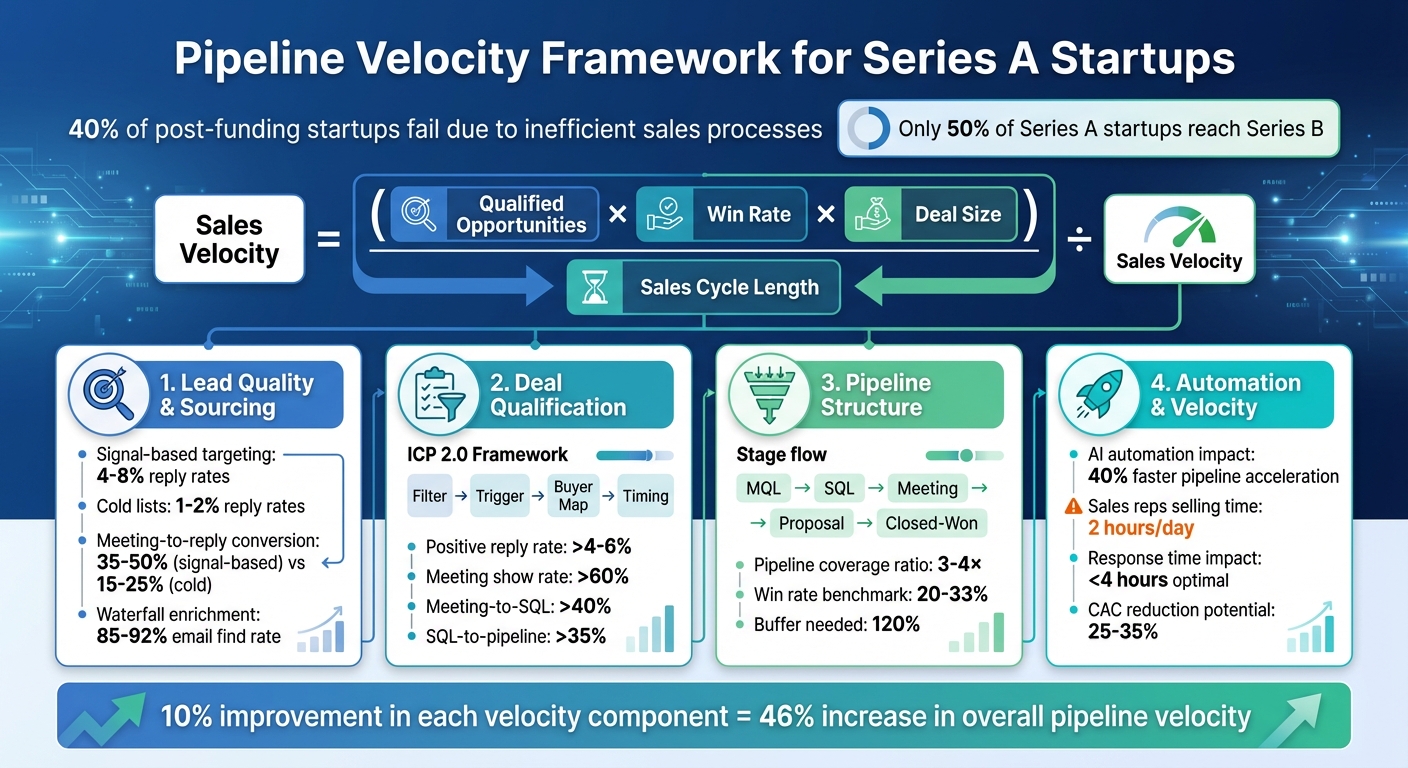
Pipeline Velocity Framework for Series A Startups
Checklist: Lead Sourcing and Quality Validation
The strength of your pipeline depends on the quality of the leads you bring in. Many Series A startups waste time and resources chasing prospects that don’t convert because they lack a structured approach to sourcing and validating leads. Targeting the right accounts with accurate, actionable data is key to driving ARR growth.
Document and Track All Lead Sources
Every lead should be traceable. When a lead enters your CRM, it needs to be tagged with its source, the triggering signal, and the date it was captured. A 7-layer GTM system – including steps like ICP/Signal Definition, Signal Detection, Workflow Automation, and AI Personalization – can replace outdated manual methods like list-building, which quickly lose relevance. Instead, automate the detection of buying signals, such as leadership changes, increased hiring, or visits to high-intent pages, and enrich these leads before they reach your CRM.
For example, FreightTech company TruckX shifted from volume-based outbound to signal-based targeting and saw remarkable results. By focusing on compliance-sensitive third-party logistics providers and targeting expansion signals, they achieved a 4.5× increase in booked meetings within 30 days and boosted sales velocity by 38% between 2024 and 2025.
Track your leads across six core GTM motions: Inbound-led, Outbound-led, Product-led (PLG), Channel/Partner-led, Event-led, and Community-led. Tools like n8n can automate workflows by filtering for ICP matches, checking for duplicates, and routing leads for enrichment. This automation ensures leads are ready for action.
Signal-based targeting significantly outperforms traditional methods. While cold lists yield 1% to 2% reply rates, signal-triggered sequences achieve 4% to 8%. Moreover, meeting-to-reply conversion rates jump from 15% to 25% (cold lists) to 35% to 50% with signal-based targeting.
Validate Lead Quality Metrics
Once leads are captured, the next step is to confirm their quality.
Not all leads are created equal. A lead that matches your firmographics but lacks a clear buying trigger only clutters your pipeline. Validation ensures that leads meet conversion benchmarks and align with your buyer personas before they reach sales.
Use the ICP 2.0 framework, which evaluates leads based on four components:
- Filter: Company size, industry, revenue.
- Trigger: The event or change creating urgency.
- Buyer Map: Decision-making structure and key stakeholders.
- Timing Window: The best time to make contact (e.g., new VPs of Sales are most receptive 14–45 days after starting).
"Pipeline isn’t a product of effort – it’s a product of alignment."
– Sani Zehra, Content & SEO Specialist, Phi Consulting
Set clear performance benchmarks: aim for 4–6% positive reply rates, a 60%+ meeting show rate, a 40%+ meeting-to-SQL conversion rate, and a 35%+ SQL-to-pipeline conversion rate. If your results fall short, the issue likely lies in misaligned leads rather than poor messaging. To test this, apply the Specificity Test: if removing names from your emails makes them generic, your lead validation process needs improvement.
Additionally, monitor technographics to ensure leads are using tools that complement your product or show signs of tech stack changes. A company adopting software that integrates with your solution is a stronger lead than one that simply fits your firmographic profile. Avoid feature-heavy messaging – contextual, relevance-driven outreach performs far better, with poorly tailored emails reducing reply rates by 55% to 60%.
Ensure Complete Data Through Enrichment
Even the best leads can stall your pipeline if their data is incomplete.
When sales teams spend hours researching basic contact details, valuable selling time is wasted. Considering that reps typically spend just two hours per day actively selling, this inefficiency can cripple your pipeline.
A waterfall enrichment process can solve this. Routing leads through tools like Prospeo, Findymail, and Datagma can achieve an 85% to 92% email find rate, compared to 60% to 75% with a single tool. The goal is to provide your team with fully enriched leads that include verified emails, direct phone numbers, company size, decision-maker roles, technographics, funding events, and hiring patterns.
Automation plays a key role here. AI tools like Claygent can analyze LinkedIn activity and company news to create rich, context-aware profiles. This goes beyond basic personalization – your team gets insights into the prospect’s recent initiatives or challenges, making outreach feel relevant rather than robotic. In 2026, relevance isn’t just a luxury – it’s the standard.
Checklist: Deal Qualification Criteria
Once your pipeline is filled with enriched leads, the next challenge is identifying deals that are truly worth pursuing. Too often, Series A startups waste time chasing opportunities that lack urgency, budget, or the right decision-making structure. Without a clear, consistent qualification process, your team risks investing resources in deals that will never close.
Create a Consistent Qualification Scorecard
To streamline deal qualification, refine your scorecard by incorporating firmographics, trigger events, and buyer maps. The ICP 2.0 Framework – which combines these elements with timing – helps assess opportunities based on actionable signals rather than broad account lists. This approach ensures you’re targeting prospects with pressing needs.
For instance, instead of a vague target like "SaaS companies with 50–200 employees", focus on something more precise: "Series A SaaS companies that recently hired their first VP of Sales and are scaling from 5 to 15 reps." This level of detail significantly improves conversion rates. Signals to prioritize include leadership changes, hiring surges in specific roles (e.g., SDRs), tech stack updates, and upcoming compliance deadlines.
Your scorecard should also assess Problem-Solution Fit – does your product address a pressing challenge for the prospect? – and Defensibility, which evaluates whether your competitive edge can be maintained. Additionally, track key metrics like unit economics: aim for a Customer Acquisition Cost (CAC) to Lifetime Value (LTV) ratio of at least 3x and a payback period under 12 months. By applying these criteria, you’ll ensure deals move faster through the pipeline, increasing overall efficiency.
Identify Market Fit and Growth Potential
Even the best product can’t succeed in a shrinking or niche market. Investors expect scalable returns, so your qualification process must confirm that each deal aligns with a market capable of delivering substantial growth. This is especially critical for Series A startups, as 60% of companies that secure Seed or Series A funding never make it to Series B. Of these failures, over 40% stem from go-to-market missteps or cost inefficiencies.
"Even the best product will fail if the market is too small or shrinking. Investors seek opportunities with the potential for scalable returns."
– Mayur Toshniwal, Qubit Capital
To demonstrate market potential, define TAM (Total Addressable Market), SAM (Serviceable Available Market), and SOM (Serviceable Obtainable Market) for each opportunity. Use refined ICP data, including technographics – like the tools a prospect already uses – and trigger events such as funding rounds or new leadership hires. For example, a company that just raised a Series A round and is hiring a Head of Revenue Operations is far more likely to invest in revenue infrastructure than one showing no signs of growth.
Monitor buying signals to validate growth potential. Look for signs like hiring intent, adoption of competitor tools, and visits to high-intent website pages (e.g., pricing or documentation). These indicators suggest the prospect is actively exploring solutions and has the budget to act. For B2B SaaS startups aiming to secure Series A funding, benchmarks often include $1M–$3M in ARR and annual revenue growth exceeding 100%.
Document Decision-Maker Identification
A deal won’t move forward without identifying the key decision-makers. Currently, sales reps spend just two hours a day selling, with the rest of their time lost to administrative tasks and research. To avoid this inefficiency, your qualification process must pinpoint the right stakeholders within each account.
Start by mapping the buying committee. This typically includes the CEO, CFO, and the department head directly impacted by your solution. Use signal-based identification to target decision-makers during their "propensity to buy" window – for example, new leadership hires, recent funding rounds, or aggressive hiring for specific roles. VPs of Sales, for instance, are most receptive 14–45 days into their role, making this the ideal time to engage.
Adopt a multi-threaded outreach strategy, engaging 5–10 contacts per account instead of relying on a single point of contact. This approach builds social proof and helps uncover internal champions or blockers. Seeing multiple mutual connections can increase a decision-maker’s confidence in your solution. Additionally, leverage AI tools to gather insights from LinkedIn, annual reports, and news mentions, enabling you to craft outreach that aligns with the decision-maker’s current priorities and challenges.
| Identification Method | Best For | Key Benefit |
|---|---|---|
| Buying Committee Mapping | High ACV / Enterprise | Ensures all blockers (CFO/CEO) are addressed early |
| Signal-Based Selling | Timing the Market | Reaches buyers exactly when they are ready to purchase |
| AI Personalization | High-volume outreach | Demonstrates deep research and relevance at scale |
| Social Selling | Building Trust | Warms up leads through community engagement before direct outreach |
Once you’ve identified qualified deals, the next step is assigning clear ownership and ensuring smooth stage progression to keep the pipeline moving forward.
Checklist: Pipeline Stages and Deal Ownership
A structured pipeline is the backbone of predictable revenue, especially when founders need to step back from day-to-day sales involvement. By Series A, investors want to see a process where deals flow smoothly through defined stages, not a chaotic mix of unstructured conversations. Without clear stages and ownership, deals stall, and forecasting turns into guesswork.
Define Pipeline Stages with Entry and Exit Criteria
Every pipeline stage should have specific entry and exit criteria. For example, a lead might move from MQL (Marketing Qualified Lead) to SQL (Sales Qualified Lead) once a BDR qualifies them. Common stages for Series A startups include MQL, SQL, Meeting Held, Proposal, and Closed. For Product-Led Growth (PLG) companies, the focus often shifts to PQL (Product Qualified Lead) – those users who hit that critical "aha!" moment within the product.
High-growth SaaS companies aim for a pipeline-to-quota coverage ratio of 3× to 4×, adjusted based on win rates. They also track key conversion metrics, such as a meeting-to-SQL rate above 40%, an SQL-to-pipeline rate over 35%, and a meeting show rate higher than 60%. Weekly audits of your pipeline help identify bottlenecks. For instance, a high drop-off between SQL and Opportunity might mean your qualification criteria are too loose, while delays in the Proposal stage could point to missing stakeholders or unresolved concerns.
To keep deals moving, plan for a 120% buffer in pipeline velocity. This accounts for unexpected churn or deals that slip.
| Pipeline Stage | Key Entry/Exit Criteria | Target Conversion Metric |
|---|---|---|
| MQL | ICP fit plus intent signal (e.g., content download) | N/A |
| SQL | Qualified by BDR/SDR; meeting booked | >40% (Meeting to SQL) |
| Opportunity | Meeting held; pain points and budget confirmed | >35% (SQL to Pipeline) |
| Proposal | Solution presented; stakeholders identified | N/A |
| Closed-Won | Contract signed; handoff to Customer Success | ~20–33% (Win Rate) |
Once your stages are defined, assigning a single owner to each deal becomes essential.
Assign One Owner to Each Deal
Every deal needs a single, clear owner responsible for its progress and CRM updates. Without this, accountability gets murky – Marketing might blame Sales for dropped follow-ups, while Sales might point fingers at poor lead quality. This lack of clarity can lead to deals falling through the cracks.
Clear ownership allows leadership to track key metrics like pipeline generated per rep or the number of attempts per meeting. These insights help pinpoint inefficiencies. Timing also matters. For example, a funding announcement becomes less actionable after 7–10 days, and a new hire is most responsive between 15 and 45 days. Automated routing tools, like Slack alerts, can ensure the owner responds within 4 hours. Companies using AI-driven automation for repetitive tasks have reported up to 40% faster pipeline acceleration.
To further streamline the process, create a buyer map for each deal. This map should identify the "Pain Owner", "Budget Owner", and "Blocker" within the decision-making chain. Combining clear ownership with automation reduces administrative work, allowing your team to focus on selling.
Maintain CRM Accuracy and Team Visibility
Accurate CRM data is about more than just keeping things tidy – it ensures everyone operates with the same "pipeline truth." Incomplete or inaccurate data can lead to misleading metrics, such as tracking emails sent instead of actual outcomes like meetings held or revenue generated. Regular CRM audits and unified dashboards prevent data silos and foster cross-functional alignment.
For example, in 2025, a growth-stage FinTech company partnered with Phi Consulting to address a stagnant pipeline and rising Customer Acquisition Costs (CAC). By consolidating their GTM stack and implementing unified dashboards, they cut CAC by 25–35% within a quarter and doubled their pipeline growth without increasing headcount.
Weekly learning loops are another powerful tool. Use these sessions to capture live objections and analyze "Closed-Won" deals to reverse-engineer success. This approach ensures that Marketing, Sales, and Customer Success work from the same playbook. Additionally, leveraging AI tools for routine CRM updates frees up your sales team to focus on meaningful conversations rather than data entry.
Checklist: Velocity Measurement and Bottleneck Resolution
Understanding your pipeline velocity is key to uncovering what’s slowing your sales engine down. For Series A startups, clarity on where deals stall, how long they take to close, and which segments move fastest can transform guesswork into a reliable, repeatable process that builds investor confidence. By diving deeper into these metrics, you can pinpoint exactly where your pipeline is getting stuck.
Track Average Deal Cycle Time by Segment
The Sales Velocity Formula is a powerful way to gauge your pipeline’s overall health: (Number of Open Qualified Opportunities × Win Rate × Average Deal Size) / Average Sales Cycle Length. This formula helps you identify which part of the equation – volume, conversion, deal value, or time – is holding you back.
Breaking down cycle times by segment can highlight bottlenecks. For example, inbound leads often close faster since they’re already warm, while outbound deals might take longer but allow more control over targeting high-value accounts. Enterprise deals naturally have longer cycles compared to mid-market ones. Take TruckX, a FreightTech company, as an example. In 2025, they worked with Phi Consulting to analyze their pipeline and found that enterprise 3PLs had different cycle times than mid-market accounts. Adjusting their approach for each segment helped them refine their sales process.
It’s also wise to build in a 120% buffer for your pipeline velocity to account for deals slipping to the next quarter or unexpected churn. Leveraging AI-driven automation can further speed up pipeline velocity by as much as 40%.
Analyze Drop-Off Rates by Stage
Drop-off rates are a clear indicator of where your process is breaking down. For instance:
- If deals stall between SQL and Opportunity, your qualification criteria might be too broad.
- If deals drop off at the Proposal stage, you may be missing key stakeholders or not addressing core objections effectively.
To diagnose these issues, set specific thresholds. For example:
- A positive reply rate under 2% suggests problems with targeting. Tighten your ICP filters and audit your signal quality.
- A meeting show rate below 50% indicates loose qualification. Add qualifying questions to your booking flow.
- If SQL conversion is below 25%, it might mean your messaging isn’t resonating or your AE handoff needs improvement.
| Symptom | Likely Root Cause | Fix/Action |
|---|---|---|
| Positive reply rate < 2% | Targeting issues | Audit signal quality; tighten ICP filters |
| Meeting show rate < 50% | Loose qualification | Add qualification questions to booking flow |
| SQL conversion < 25% | Messaging misalignment | Review lost-meeting notes; improve AE handoff |
| Deliverability < 70% | Damaged infrastructure | Fix SPF/DKIM/DMARC; ramp volume gradually |
In 2025, a growth-stage FinTech company discovered rising CAC despite having a full-stack GTM team. A Phi Consulting audit revealed 11 disconnected tools in their stack, leading to untrustworthy dashboards and data silos. By cutting their tools down to 4 and creating unified dashboards, they reduced CAC by 25–35% in one quarter and doubled their pipeline without adding headcount.
Timing plays a crucial role, too. A funding announcement loses its impact after 7–10 days, while new hires are most responsive between 15 and 45 days. Missing these windows can cost you deals before they even enter your pipeline.
Once you’ve identified drop-off points, make it a habit to review and address them regularly.
Conduct Quarterly Bottleneck Reviews
Quarterly reviews are essential for identifying and fixing recurring bottlenecks. Bring together your entire GTM team – Sales, Marketing, and Customer Success – to ensure everyone is aligned. Use these sessions to analyze win/loss notes, review drop-off rates by stage, and gather live objections from recent deals. This alignment can lead to a 20–30% reduction in CAC.
"Pipeline isn’t a product of effort – it’s a product of alignment." – Sani Zehra, Content & SEO Specialist, Phi Consulting
Act quickly on stalled deals by conducting loss post-mortems within 48 hours. Ask questions like: Did we target the right ICP? Was our messaging focused on solving pain points rather than just listing features? Did we identify all decision-makers early? These insights can help refine your approach before the next quarter begins.
If your pipeline velocity consistently lags behind growth targets, consider a 360° GTM Audit. This involves reviewing your tech stack for redundancy, analyzing hiring bursts or tool changes with platforms like Clay, and applying the "So-What?" test to your cold email openers to ensure they provoke action rather than just pitching features. For Series A startups, proving a repeatable GTM engine is critical to securing the next funding round. Regular reviews ensure you’re improving proactively, not just reacting to missed goals.
Checklist: CRM and Automation Setup
Your CRM should be more than a glorified spreadsheet – it’s the backbone of your sales operation. For Series A startups, having a properly configured CRM can be the difference between building a predictable sales engine and losing deals to inefficiency. The right setup eliminates repetitive tasks, highlights bottlenecks as they happen, and frees your team to focus on selling instead of data entry.
Configure CRM for Full Pipeline Visibility
Start by automating data entry wherever possible. Tools like Clay or Apollo can feed leads directly into your CRM without requiring manual uploads. This not only preserves data accuracy but also keeps your sales momentum going. Considering sales reps spend less than half their day selling, automation can reclaim hours otherwise lost to admin work.
Set up workflows triggered by buying signals – like visits to your pricing page, funding announcements, or job changes – rather than relying on static outreach schedules. These signal-based sequences outperform traditional cold outreach, showing reply rates of 4% to 8%, compared to just 1% to 2% for standard lists. Even meeting-to-reply conversions jump to 35% to 50%, compared to 15% to 25% for cold lists.
Use tools like Slack or Microsoft Teams to route replies and ensure response times stay under four hours. Fast responses matter – a lead contacted within five minutes is 21 times more likely to qualify than one reached after 30 minutes. Also, make sure your CRM and email tools are properly configured with SPF, DKIM, and DMARC records to ensure email deliverability rates above 75%.
Finally, align your sales, marketing, and customer success teams around a shared data model in your CRM. This ensures everyone tracks pipeline velocity and conversion rates using the same metrics.
Activate Automated Follow-Up Reminders
Closing deals often takes persistence. While 80% of deals require at least five touchpoints, nearly half of salespeople give up after just one follow-up. Automating reminders tied to key pipeline events can help maintain momentum. For example, less than 35% of leads typically receive more than two follow-up attempts, leaving significant opportunities on the table.
Set up alerts for deals with no activity logged in 14 days – this helps you tackle the 25% to 40% of pipelines that often go stale. Use AI tools to monitor engagement signals like email opens, website visits, or sentiment changes during calls. These signals can trigger timely reminders to act before deals grow cold.
Establish service-level agreements (SLAs) for follow-ups at each stage. For instance, if no response is received 48 hours after sending a proposal, a follow-up task should automatically be created. Modern B2B sales often involve 6 to 10 stakeholders, so multi-threaded outreach – combining email, LinkedIn, and phone – is far more effective than sticking to a single channel.
Build Velocity-Focused Dashboards
Your dashboards should focus on the four key elements of pipeline velocity: Qualified Opportunities, Average Deal Size, Win Rate, and Sales Cycle Length. The goal? Track how much revenue you’re generating daily, weekly, or monthly. Even small improvements – like a 10% boost in each velocity component – can lead to a 46% increase in overall pipeline velocity.
Avoid lumping everything into blended metrics. Instead, segment views by product line, region, sales rep, or customer type (e.g., SMB vs. Enterprise). Monitor idle time between stages and conversion rates at each transition to pinpoint where deals are stalling. Incorporate AI-driven insights, like email response rates or stakeholder engagement, to refine your strategy further.
Connect your CRM directly to an analytics platform to identify patterns and trends in real time, skipping the need for manual spreadsheets. Only 20% of sales teams hit their revenue forecasts within 5%, often because they fail to track shifts in pipeline velocity. Set up alerts for stalled deals that exceed 2–3 times your average sales cycle length to keep your pipeline healthy.
"You can’t optimize what you don’t track." – HockeyStack
For startups just starting with velocity-focused dashboards, expect to invest $700 to $1,500 per month for a basic GTM setup. A more advanced enterprise-level system can cost $2,500 to $4,000 per month. While the upfront cost may seem steep, it quickly pays off by uncovering hidden inefficiencies that slow down your sales pipeline.
Conclusion
Pipeline velocity acts as the heartbeat of your Series A startup’s revenue engine. It reveals whether you’ve built a repeatable system for growth or are still leaning on founder-led sales to drive results. Here’s a stark reality: only half of Series A startups make it to Series B, with over 40% of failures linked to inefficiencies in their go-to-market (GTM) approach. The line between securing investor confidence and watching your runway evaporate often boils down to how efficiently you convert qualified leads into closed deals.
Key stall points – like inconsistent lead qualification, unclear sales stages, and process bottlenecks – can quietly undermine progress. Yet, even modest improvements can have a massive impact. For instance, a 10% boost in opportunity count, win rate, deal size, and cycle length can drive a 46% increase in pipeline velocity. That kind of lift can mean the difference between hitting your growth milestones or falling behind.
At the heart of it all is execution consistency. Companies that align their customer-facing teams see revenue growth that’s 2.4x higher and profitability growth that’s twice as fast. But achieving this alignment requires more than just patching together tools – it demands a unified system. Your CRM, outbound strategy, and analytics dashboards need to function seamlessly, amplifying momentum rather than creating chaos.
If you’re ready to leave manual processes behind and build a scalable revenue engine, GTM Engineering Services specializes in creating systems that turn outbound efforts into predictable results. From intelligent lead scoring and multi-channel outreach to CRM automation and velocity-focused dashboards, we help Series A and Series B startups prove they have a scalable GTM model – not just a great product.
FAQs
What’s a good pipeline velocity target for a Series A startup?
For a Series A startup, setting a solid pipeline velocity target is all about driving efficient revenue growth. The goal? Keep your payback period under 18 months. At the same time, focus on speeding up deal cycles and boosting conversion rates. Hitting these benchmarks not only ensures you’re scaling effectively but also aligns perfectly with your go-to-market strategy.
How do I pick the best buying signals for my ICP?
The key to effective outreach is focusing on buying signals that reveal genuine interest and engagement from high-value prospects. Keep an eye out for signs like recent initiatives they’ve launched, clear pain points they’re trying to address, major organizational changes, or a noticeable uptick in account activity.
Leveraging enriched data alongside AI-driven lead scoring can help you zero in on these signals with precision. When you target prospects based on these insights, your outreach becomes more relevant to their current needs, boosting your chances of turning interest into conversions.
Which CRM automations should we set up first to speed deals up?
Start by setting up automation for lead qualification and nurturing workflows. Prioritize tasks like lead scoring and routing to ensure high-value prospects are quickly identified and connected to the right sales reps. On top of that, implement automated personalized outreach sequences – such as follow-up emails triggered by specific lead actions. This approach not only reduces manual work but also keeps engagement timely, creating a scalable pipeline that speeds up deal progression.