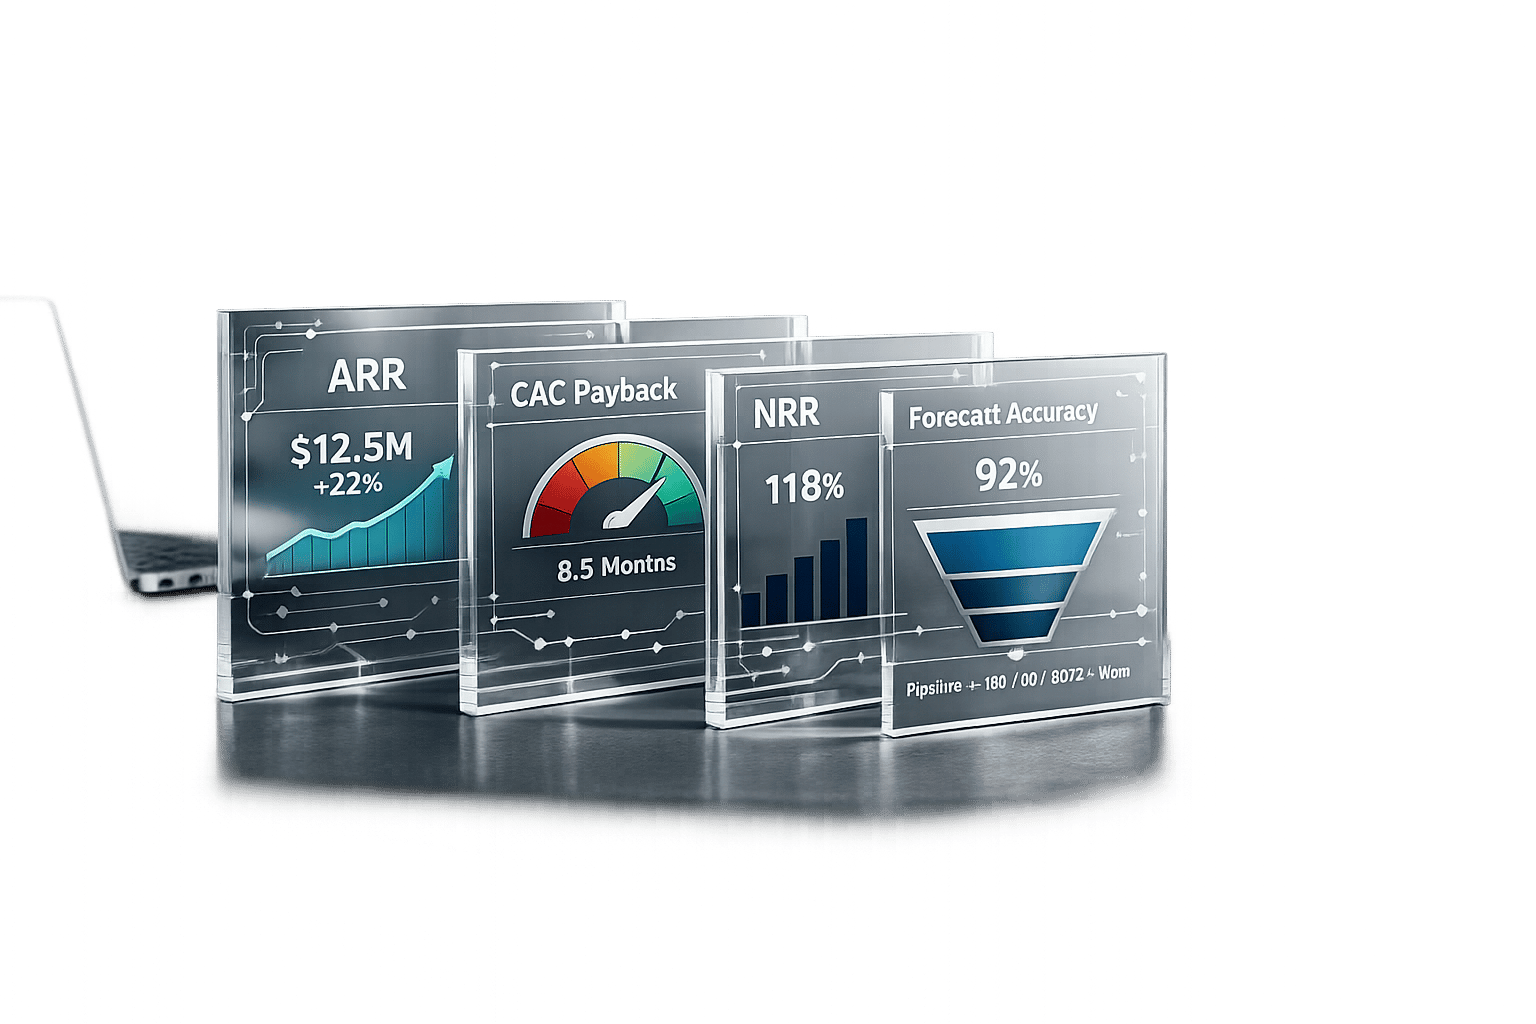
Revenue Operations (RevOps) benchmarks are essential for startups aiming to scale efficiently. They provide clear performance standards across sales, marketing, and customer success, replacing guesswork with data-driven insights. Startups with strong RevOps systems grow revenue 19% faster, achieve 15% higher win rates, and are 1.4x more likely to exceed revenue goals.
Key benchmarks include:
- ARR Growth: Series A startups should aim for pipeline velocity of $125,000/month, scaling to $280,000 by Series B.
- CAC Payback: 12–15 months for Series A, 10–12 months for Series B.
- Net Revenue Retention (NRR): Target 110–130% for long-term sustainability.
- Forecast Accuracy: 80–85% for Series A, improving to 90–95% by Series C+.
- Pipeline Metrics: Maintain a 3–4× pipeline coverage ratio for predictable revenue.
To hit these benchmarks, startups must focus on building automated systems, integrating tools, and maintaining clean data. For example, automating lead routing and CRM workflows can cut manual tasks by 20+ hours weekly. Companies that adopt AI for forecasting and enrichment see 23% higher accuracy and faster growth.
The takeaway: RevOps isn’t just a function – it’s the backbone of scalable growth. Start by auditing your current systems, identifying gaps, and implementing infrastructure to align with these benchmarks.
Core Revenue Operations Metrics and 2026 Benchmarks
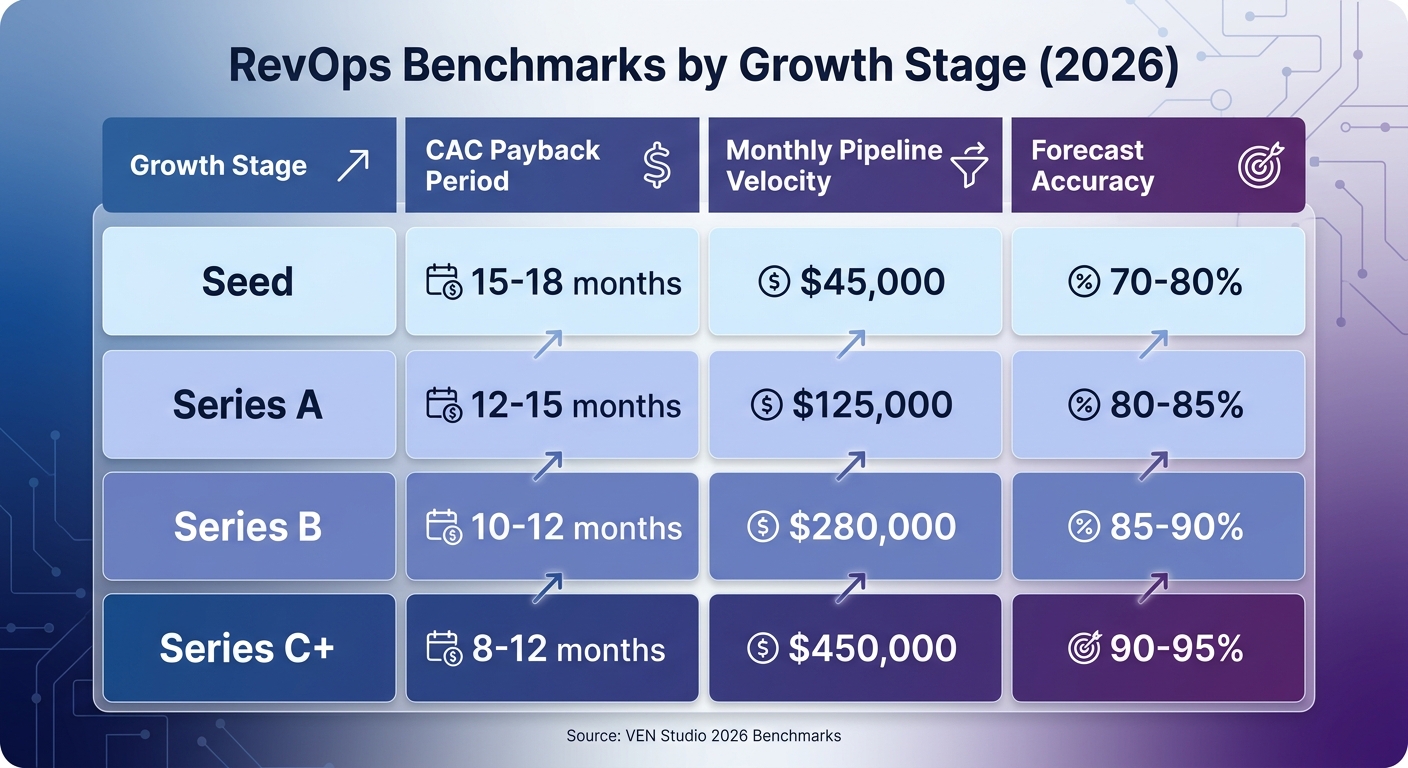
RevOps Benchmarks by Startup Growth Stage: Seed to Series C+
Annual Recurring Revenue (ARR) Growth
ARR growth is a critical marker of scalability, especially as companies move beyond founder-led sales. Businesses with well-established RevOps systems report a 19% faster year-over-year revenue growth compared to those relying on outdated tools like spreadsheets or intuition. However, ARR growth alone isn’t enough – it needs to be balanced with efficiency metrics to maintain strong unit economics.
A standout metric here is pipeline velocity, which measures how quickly revenue flows through your system. It’s calculated using this formula:
(Number of Opportunities × Average Deal Size × Win Rate) ÷ Sales Cycle Length.
For perspective, a healthy pipeline velocity at Series A should hit around $125,000 per month, scaling to $280,000 by Series B. If your numbers fall short, it’s essential to identify whether the issue lies in deal size, win rate, or sales cycle length. This metric not only highlights your revenue process’s efficiency but also lays the groundwork for evaluating customer acquisition and retention.
Customer Acquisition Cost (CAC) Payback Period
Once ARR growth is understood, the next step is managing acquisition costs. The CAC payback period measures how long it takes to recover the cost of acquiring a customer – a key metric for managing runway and impressing investors. For Series A companies, the target is a 12–15 month payback period, while Series B companies should aim for 10–12 months. Seed-stage companies often see longer payback periods of 15–18 months, but anything beyond this range could indicate inefficiencies.
The urgency of refining acquisition strategies is underscored by a 222% increase in CAC over the past eight years. To simplify, here’s a snapshot of key benchmarks by stage:
| Stage | CAC Payback Target | Monthly Pipeline Velocity | Forecast Accuracy |
|---|---|---|---|
| Seed | 15–18 months | $45,000 | 70–80% |
| Series A | 12–15 months | $125,000 | 80–85% |
| Series B | 10–12 months | $280,000 | 85–90% |
| Series C+ | 8–12 months | $450,000 | 90–95% |
Source: VEN Studio 2026 Benchmarks
Net Revenue Retention (NRR) and Pipeline Metrics
Net Revenue Retention (NRR) is another cornerstone metric, offering a view of long-term revenue sustainability. It tracks growth from upsells, cross-sells, and renewals while accounting for churn. By 2026, top SaaS companies are aiming for NRR rates between 110–130%.
Pipeline metrics also play a crucial role in revenue predictability. High-performing teams maintain a 3–4× pipeline coverage ratio, meaning their pipeline holds three to four times the value of their quarterly revenue target. Win rates, which vary by market segment, provide additional clarity. For example, Series A companies targeting SMBs typically see win rates of 15–20%, while mid-market deals often convert at 20–25%.
Lastly, forecast accuracy is a hallmark of elite RevOps teams. The goal is to stay within a 5% variance, with Series A teams achieving 80–85% accuracy and Series C+ companies reaching 90–95%. However, the reliability of these insights depends heavily on CRM data quality – a known weak spot for many organizations. Alarmingly, 70% of CRM systems suffer from significant accuracy issues, with data decaying at a rate of 22–34% annually.
RevOps Maturity Stages and Benchmarks
Understanding the stages of RevOps maturity is key to aligning your infrastructure goals with your company’s growth. This isn’t about flipping a switch – it’s about evolving alongside your revenue trajectory. Each stage, from $1 million to $50 million ARR and beyond, demands a tailored approach to systems and processes. Knowing where you stand helps you prioritize effectively and avoid overcomplicating things before you’re ready.
Stage 1: $1-10M ARR
This is where you shift from founder-led sales to a repeatable, scalable process that can sustain growth. The objective here is to establish a single source of truth in your CRM, ensuring your sales model is ready to scale. For companies under $5 million ARR, RevOps adoption hovers at 41%, with most teams relying on a single generalist to handle data entry and basic reporting tasks.
Key benchmarks at this stage revolve around building a solid foundation. Aim for 70% CRM data completeness, use manual lead routing with clear handoff protocols, and target forecast accuracy between 70% and 80%. Defining your Ideal Customer Profile (ICP) is critical, as Ev Kontsevoy, CEO of Teleport, highlights:
"Before we ramped sales, we needed a crisp answer to four questions: What do we sell? Who is our customer? Why do they buy? And why do they buy from us?"
Typically, your RevOps team will consist of one generalist for every 25–30 revenue team members. Early-stage CAC payback periods should align with industry norms. Once these basics are in place, you’re ready to move toward more structured processes in Stage 2.
Stage 2: $10-50M ARR
At this point, the focus shifts from managing chaos to building structured systems. RevOps adoption climbs to 74–89% in this revenue range, and your team should grow to include 2–8 specialists covering operations, enablement, and analytics.
Benchmarks become more demanding: aim for 85% forecast accuracy, 80–90% CRM data completeness, and CAC payback periods of 10–15 months. This is also the time to embrace automation, using tools like automated workflows, integrated lead intelligence, and territory planning software. For instance, Collibra cut its territory planning time by 30% by ditching spreadsheets in favor of intelligent planning tools, which led to faster resource allocation and a fairer distribution of opportunities.
Hitting these benchmarks sets the stage for a more strategic, AI-driven approach in Stage 3.
Stage 3: $50M+ ARR
At this level, RevOps becomes a strategic function embedded in the C-suite, often led by a Chief Revenue Operations Officer. Companies exceeding $100 million ARR typically see RevOps adoption rates of 96%, with teams expanding to 8–40+ specialists. The focus here is on AI-driven orchestration, connecting data signals, enrichment, and outreach into seamless workflows.
Your benchmarks now reach the highest standards: 90–95% forecast accuracy, 95%+ CRM data quality, and CAC payback periods of 8–12 months. Static reviews should give way to real-time dashboards and AI-powered forecasting. For example, between late 2025 and early 2026, Salesforce deployed autonomous AI agents that engaged with 130,000 previously untouched leads in just four months, generating 3,200 new opportunities. Mature organizations also maintain a RevOps ratio of 1 specialist for every 15–20 revenue team members and treat data decay (about 30% annually) as a daily challenge.
For companies ready to tackle these advanced benchmarks, partnering with experts like GTM Engineering Services can help you build the scalable, automated infrastructure needed to keep growing. These benchmarks serve as a guide to refining your RevOps strategy as your business reaches new heights.
Tools and Systems for Tracking Benchmarks
To effectively track RevOps benchmarks, you need a streamlined tech stack. By 2026, leading teams have reduced their toolset to 7–8 integrated platforms, compared to an average of 12 in prior years, as 67% of leaders work to minimize fragmentation in their systems.
The trend is clear: automated, signal-driven orchestration is replacing outdated methods. Instead of static lists and arbitrary outreach schedules, systems now monitor buying triggers – like funding rounds, hiring surges, or tech stack updates – to launch automated workflows. As highlighted in the State of RevOps 2026 Analysis:
"The best sales organizations in 2026 treat AI agents not as a replacement for human connection – but as the infrastructure that makes human connection possible at scale."
This shift means your tools need to integrate seamlessly, ensuring every part of the system works together rather than operating in isolation.
CRM Automation and Workflow Design
Modern CRMs like Salesforce and HubSpot now integrate with CDPs, eliminating up to 20 hours of manual data reconciliation each week.
The real game-changer lies in automated workflows. High-performing RevOps teams achieve a workflow execution success rate of over 98%. This means leads are scored, routed, and enriched automatically. For instance, when a lead hits a specific score, the system assigns it to the right rep, launches a tailored outreach sequence, and logs all interactions in the CRM – no manual effort required.
Disconnected systems, however, remain a major obstacle. David Ruggiero, President of GTM at Outreach, explains:
"Many organizations take a siloed approach… They use a mashup of disparate systems and processes to manage the revenue cycle, which causes sellers, managers and leaders to manually piece together a picture of everything happening in their pipelines."
This fragmentation slows progress, with 51% of sales leaders reporting that disconnected systems hinder their AI and automation efforts. The solution? Invest in platforms that naturally support signal detection, enrichment, and CRM logging in one cohesive flow. For example, GTM Engineering Services specializes in building integrated systems for startups, connecting tools like HubSpot or Salesforce with lead intelligence and outbound platforms to create a seamless revenue process.
Pipeline Analytics and Dashboards
Once CRM workflows are automated, real-time analytics take your revenue system to the next level. Static quarterly reviews are outdated. Instead, real-time dashboards track metrics like stage velocity and forecast variance, helping teams identify stalled deals instantly. Companies with advanced RevOps setups see 23% higher forecast accuracy and 19% faster revenue growth, thanks to their focus on predictive analytics rather than lagging indicators.
Threshold-based monitoring is key to this approach. For example, set acceptable ranges for metrics like pipeline coverage (3–4× the quarterly target) or lead response time (under 5 minutes), and get alerts when numbers fall outside these bounds. This proactive style shifts your focus from reacting to missed targets to actively optimizing your revenue system.
In 2026, Udemy demonstrated the power of this approach by implementing Fullcast‘s Revenue Command Center. They cut annual planning time by 80%, turning a months-long process into weeks. With everything from territory design to performance analytics unified in one platform, manual data stitching became a thing of the past.
AI adoption in RevOps has also surged, with 61% of teams using it in 2026. Top use cases include forecasting (52%), data enrichment (48%), and lead scoring (44%). These systems excel at high-volume pattern recognition, such as predicting deal closures with 10% accuracy.
Lead Intelligence and Enrichment Automation
Accurate data is the backbone of any revenue system. With B2B contact data decaying at a rate of 30% annually, automated enrichment ensures CRM data stays over 95% complete without the need for quarterly cleanups.
The move is toward waterfall enrichment, where platforms like SyncGTM pull data from multiple providers (e.g., Clay, Apollo, ZoomInfo) to maximize fill rates. This approach replaces the outdated reliance on a single vendor, which left leaders dissatisfied due to inaccuracies and stale data – earning a low satisfaction score of 5.92/10 in Q2 2025.
AI agents now play a critical role in tasks like account summarization, contact verification, and pre-populating CRM data, cutting manual prospecting time by 34%. For example, in early 2026, Salesforce’s AI agents re-engaged 130,000 previously untouched leads in just four months, creating 3,200 new opportunities from otherwise forgotten prospects.
While dashboards provide real-time insights, automated enrichment ensures your data remains actionable. Startups should begin by auditing their signal coverage. Identify the buying triggers most relevant to your ideal customer profile – like funding news, hiring trends, or new tech installations – and pinpoint any gaps in monitoring. Then, integrate these signals into workflows that enrich leads, update your CRM, and trigger outreach in hours, not days.
GTM Engineering Services helps Series A and B startups build these systems, connecting platforms like Clay, Apollo, and ZoomInfo with CRMs to create always-on monitoring and enrichment. This kind of infrastructure doesn’t just track benchmarks – it helps you achieve them.
How to Achieve and Measure Benchmark Performance
Reaching RevOps benchmarks means building systems that work efficiently and keeping a close eye on their performance. The numbers speak for themselves: 78% of B2B companies now have a dedicated RevOps function, a big jump from 48% in 2023. Companies with well-developed RevOps setups see 19% faster revenue growth and 15% higher win rates compared to their peers. The focus isn’t on whether to invest in RevOps but on how to do it smartly.
Audit Your Current RevOps Infrastructure
Start with a GTM Stack Audit to figure out what’s working and where things are falling short. This means reviewing every tool you use, mapping how data flows between them, and pinpointing where manual processes are slowing you down. With 67% of RevOps leaders planning to cut down on tools by 2026, the trend is shifting toward simplifying and better connecting existing systems.
Look for bottlenecks like unassigned leads or CRM data accuracy below 95%. These aren’t just small hiccups – they can seriously hurt your revenue. If you’re unsure where deals are stalling, it’s a sign your RevOps investment might not be where it needs to be. Companies that prioritize RevOps investments tend to outperform those that don’t, especially in data quality and sales cycle efficiency.
For a hands-on approach, GTM Engineering Services provides a free GTM Stack Audit. This includes a 30-minute consultation to assess your current setup, highlight gaps, and create a 90-day plan to get on track. This audit gives you a clear starting point to build systems that deliver results, not just track them.
With the audit done, you’re ready to create an integrated revenue engine.
Build Revenue Infrastructure to Meet Benchmarks
An integrated revenue engine combines multi-channel outbound systems, CRM automation workflows, and pipeline analytics dashboards. The goal is seamless data flow – from detecting signals to enrichment, outreach, and CRM updates.
One startup that adopted a RevOps strategy saw its customer acquisition cost (CAC) drop by 28% and forecast accuracy improve by 23% after setting up a dedicated RevOps team. These kinds of improvements can make the difference between burning through your budget and proving to investors that your go-to-market strategy is scalable.
Standardize processes across your revenue teams. Clearly define what counts as a Marketing Qualified Lead (MQL) versus a Sales Qualified Lead (SQL), set service-level agreements for handoffs between teams, and automate lead scoring and routing. This ensures high-intent leads reach the right person quickly. Teams that master these basics are 1.4 times more likely to surpass revenue goals by 10% or more.
Building this infrastructure typically takes 4–8 weeks and includes everything from automating lead enrichment and outreach sequences to setting up CRM workflows and analytics. It’s a complex task that requires dedicated focus and expertise.
Track and Optimize Performance Over Time
Once your revenue infrastructure is in place, the real work begins: keeping it running smoothly. Schedule weekly pipeline reviews and monthly system checks to catch problems early. As Kushal Magar from SyncGTM puts it:
"RevOps has gone from buzzword to boardroom priority".
Set up alerts for critical metrics. For example, if your pipeline coverage ratio falls below 3× your quarterly target or lead response time exceeds 5 minutes, your system should flag it immediately. High-performing RevOps teams rely on these systems to drive consistent improvements.
With 61% of RevOps teams now using AI, many are leveraging it for tasks like forecasting and data enrichment. AI can help predict which deals are likely to close and which need extra attention. However, AI is only as good as the data it’s working with, so maintaining clean, accurate data is crucial. Poor data quality costs businesses an average of $12.9 million annually.
Measure your progress against key benchmarks like a 3–4× pipeline coverage ratio, a CAC payback period under 12 months, and Net Revenue Retention above 100%. If you’re falling short, it’s a sign your systems need fine-tuning. This cycle of monitoring and adjusting is what sets fast-growing startups apart from those that hit a plateau.
Conclusion
Why Benchmarks Matter for Scaling Startups
Revenue operations benchmarks separate well-oiled systems from disorganized chaos. As Olena Petrosyuk from Waveup aptly states:
"The best time to start RevOps was when you founded your company. The second best time is now".
For Series A and Series B startups, these benchmarks provide a reality check for your revenue plans, aligning ambitious boardroom targets with the day-to-day realities on the sales floor. They allow you to shift from scrambling to meet quotas to managing the metrics that actually drive success – like pipeline velocity, ramp time, and lead response rates. Here’s a compelling stat: public companies with RevOps outperform their peers on stock performance by 71%. These aren’t just small wins; they’re the kind of results that make investors confident enough to fund your next stage of growth.
By 2026, 75% of high-growth companies are expected to implement a RevOps model. Without adopting benchmarks, startups risk facing significant challenges: up to 20–30% revenue leakage from inefficient processes and sales cycles that drag on 20% longer than necessary. Acknowledging these gaps is the first step toward building a RevOps framework that works.
Next Steps for Implementing RevOps Benchmarks
Now that the importance of benchmarks is clear, it’s time to take action. Start by conducting a GTM Stack Audit to evaluate your current position. Measure your performance against key benchmarks like a 3–4× pipeline coverage ratio and over 100% Net Revenue Retention. Once you’ve identified the gaps, focus on building the systems to close them: multi-channel outbound strategies, CRM automation workflows, and real-time pipeline analytics dashboards.
GTM Engineering Services specializes in building automated revenue systems for funded B2B startups transitioning from founder-led sales to scalable go-to-market operations. From lead intelligence and multi-channel outreach to CRM automation and pipeline analytics, we design the infrastructure that turns strategy into a predictable pipeline. Schedule a free 30-minute GTM Stack Audit to uncover your current gaps and craft a 90-day plan to hit your benchmarks.
FAQs
Which RevOps benchmarks should we prioritize first at our stage?
Early-stage companies need to prioritize two critical metrics: sales cycle length and win rates. For Series A startups, the targets are clear – strive for a 45-day sales cycle and aim for a 15% win rate. As the business grows, focus shifts to efficiency. Reducing the CAC payback period from 18 months down to 12 months becomes essential, along with keeping CRM data quality at 95% or better. Keeping an eye on pipeline velocity and identifying bottlenecks will help ensure growth stays on track.
How do we calculate pipeline velocity with our CRM data?
Pipeline velocity is a straightforward formula that helps measure how efficiently your sales pipeline is moving. It’s calculated by multiplying qualified opportunities, average deal size, and win rate, then dividing that total by the sales cycle length. Here’s how to break it down:
- Qualified Opportunities: Pull this data directly from your CRM to ensure accuracy.
- Average Deal Size: Determine this by dividing your total revenue by the number of closed deals.
- Win Rate: Calculate this by dividing the number of closed-won opportunities by the total number of opportunities.
- Sales Cycle Length: Measure the average time it takes to close a deal from start to finish.
Plug these numbers into the formula, and you’ll have a clear picture of your pipeline’s efficiency. It’s a powerful way to spot bottlenecks and identify areas for improvement.
What’s the fastest way to improve forecast accuracy without adding headcount?
To boost forecast accuracy without adding to your team, prioritize data quality and implement structured review processes. Top-performing teams keep an eye on real-time signals, define clear benchmarks for critical metrics, and hold regular check-ins to assess the health of their revenue systems. Tackling challenges like CRM data decay – which can reach up to 22% each year – and sticking to disciplined routines ensures your data stays reliable, leading to more dependable forecasts without the need for extra resources.