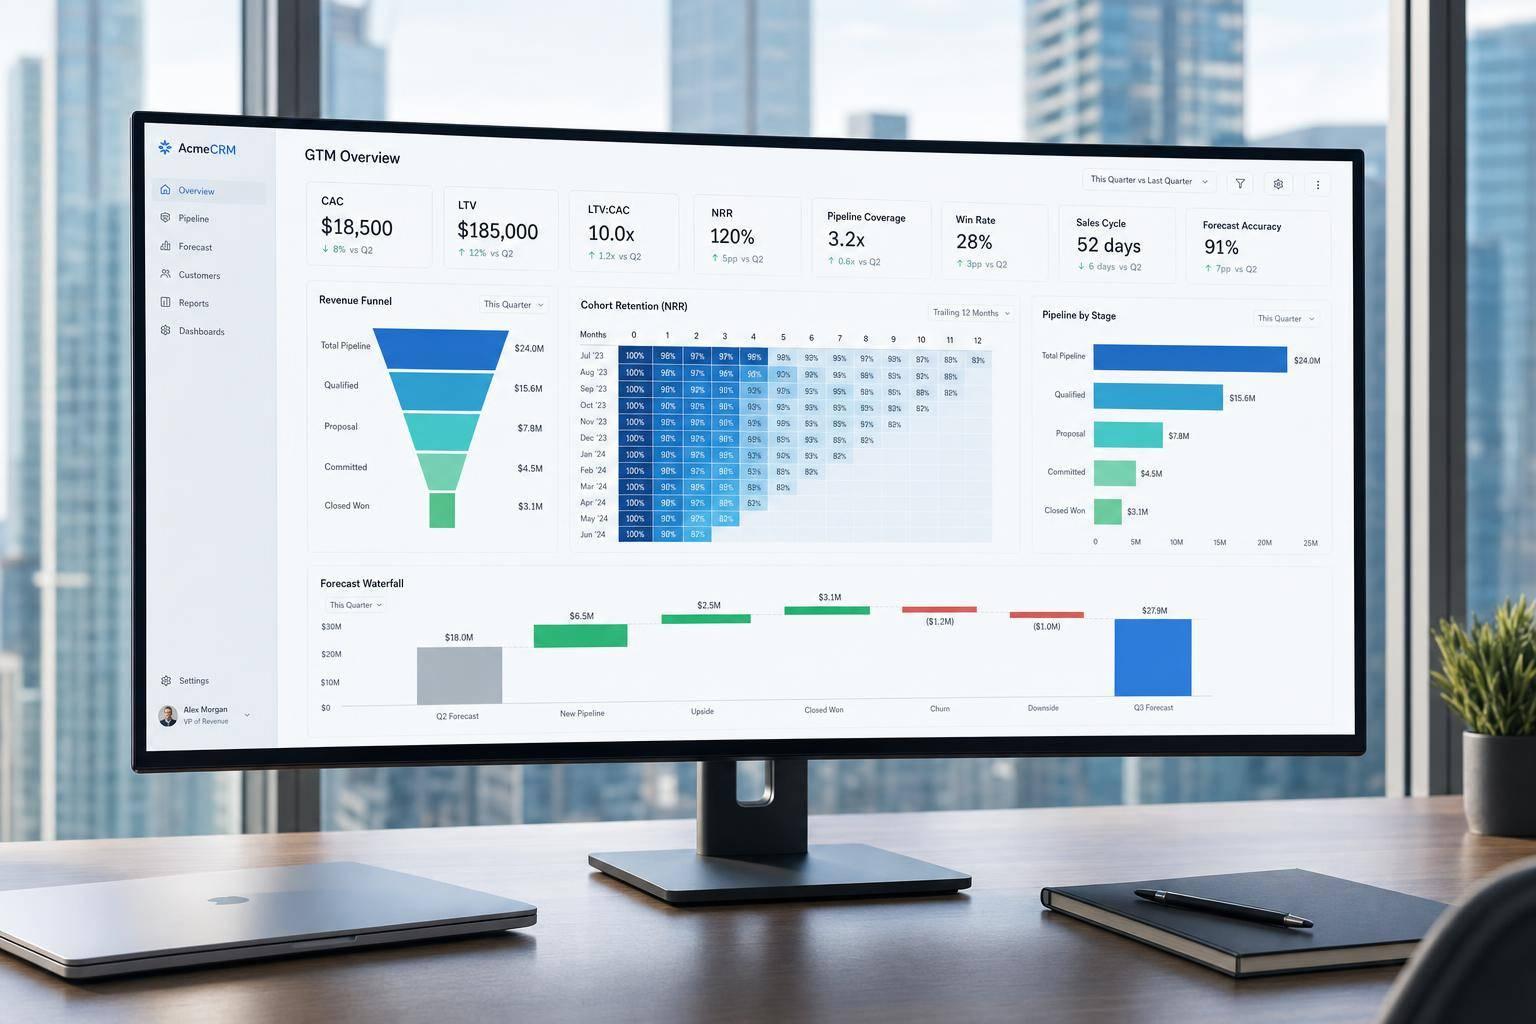
If you’re heading into a Series A process in 2026, investors want more than growth – they want proof your GTM motion works without you in every deal. The fastest way to show that is with clean CRM-backed metrics, tracked over 4 to 6 quarters, tied back to your financials.
Here’s the short version: investors are checking repeatability, efficiency, and forecast control. They want to see whether your team can keep turning a defined ICP into revenue with a sales motion that holds up as volume grows.
The core metrics they care about are:
- ARR and growth rate – Is revenue growing in a steady way?
- NRR and GRR – Do customers stay and expand?
- CAC, CAC payback, and LTV:CAC – Are you buying growth at a sane cost?
- Pipeline coverage and funnel conversion – Is future revenue already forming?
- Sales velocity and sales cycle length – How fast does pipeline turn into ARR?
- ACV and deal mix – Are deals repeatable, or are results driven by outliers?
- Logo churn and revenue churn – Is the base holding, or leaking?
- Forecast accuracy – Can the team call revenue with discipline?
A few numbers set the bar. In 2026, many Series A companies sit around $1.5M to $2.5M ARR, strong SaaS motions often show 150%+ YoY growth, investors usually look for 3x to 5x pipeline coverage, and CAC payback under 18 months is now table stakes.
What matters most is not one metric in isolation. I’d frame the story like this: clean ARR, solid retention, sane acquisition cost, steady conversion, and forecast discipline. If those pieces line up, the GTM story is much easier to defend.
Before you show the numbers, make sure the math is fixed, the CRM fields are clean, and the deck matches the data room.
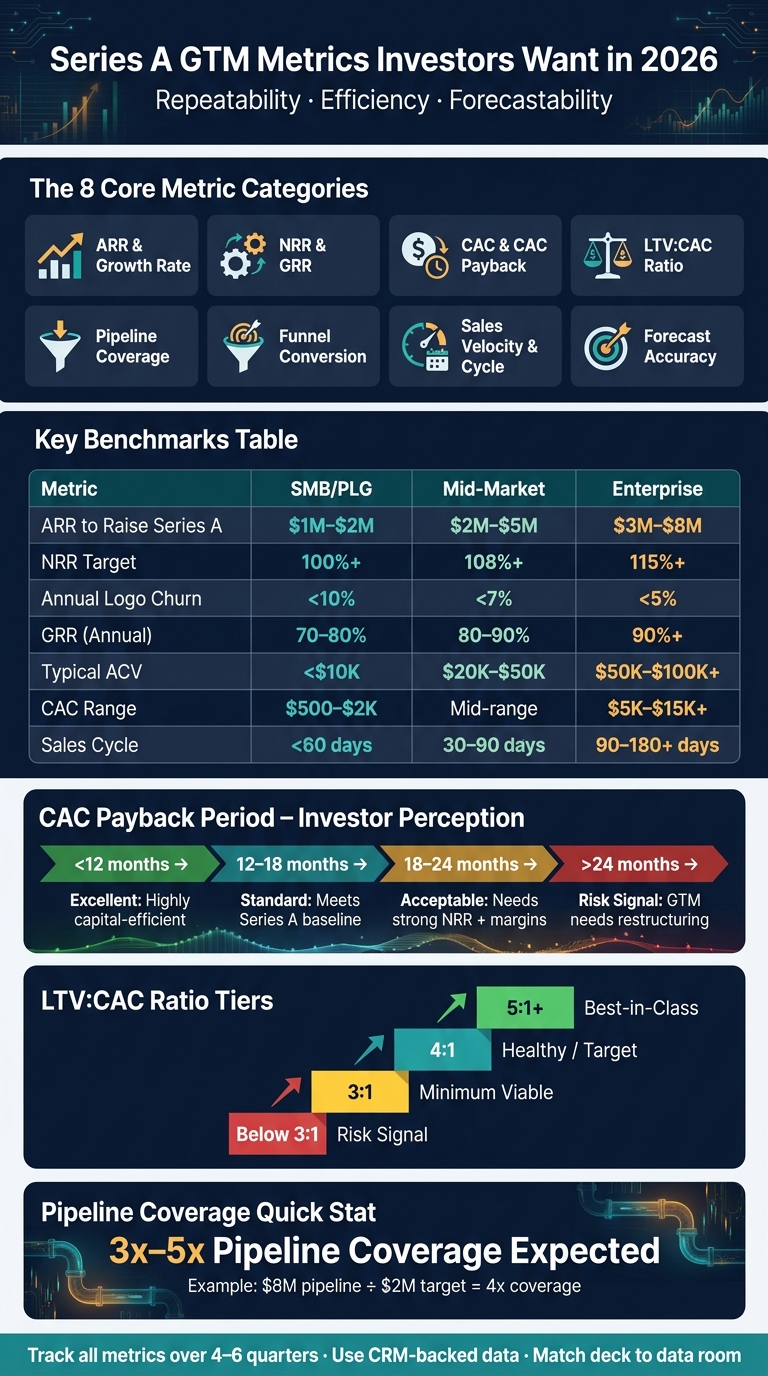
Series A GTM Metrics: Benchmarks by Segment
Why Investors Focus on GTM Metrics at Series A
At Series A, investors usually assume the product works well enough. What they want to know is simpler and harder at the same time: can your GTM motion work without the founder in the middle of every deal? They test that across three areas – repeatability, efficiency, and forecastability. So the metrics below aren’t just reporting. They’re proof.
"Series A investors are not evaluating product-market fit – that is a Seed question. They are evaluating proof of repeatability."
In 2026, investors want to see a repeatable system that converts a defined ICP without founder involvement. They care less about a few one-off wins and more about whether the motion is measurable and can grow without falling apart.
Capital efficiency matters more now, too. A burn multiple above 2x needs a clear explanation, and a Magic Number above 0.75 points to efficient growth. That line matters because it helps investors tell the difference between a GTM motion that works and one that’s just buying growth. But efficiency on paper doesn’t mean much if the data underneath is messy.
Data hygiene carries a lot of weight. Inaccurate CRM stages, missing close dates, and weak attribution don’t just create reporting gaps – they hint that the company hasn’t built clean operating habits. Investors often read CRM hygiene as a sign of whether the motion can scale without chaos.
"Investors price operating rigor, not just output."
If dashboard metrics don’t match management accounts, investors start checking the rest of the data room again. That’s why your metrics need to be framed as CRM-backed, consistently defined, and traceable to your financials – not stitched together from scattered spreadsheets.
These signals explain why the next metrics matter. They show whether the business has repeatability, efficiency, and predictability – the exact things investors use to test the GTM story.
1. Annual Recurring Revenue (ARR) and Growth Rate
ARR is usually where a Series A conversation starts. It tells investors two things fast: how big the business is today and whether the company is building steady momentum. They use it to judge if growth can keep happening, if the company is using cash well, and if revenue will hold up over time.
In 2026, Series A companies often land around $2.5M–$5M in ARR. Stronger rounds usually show $1.5M+ ARR with 150%+ YoY growth.
Repeatability
Steady ARR growth across several quarters shows that the go-to-market motion works without the founder doing all the heavy lifting. That’s a big deal. Investors want proof that hired team members can run the motion and that growth comes from a GTM engine that keeps producing, not from one hot streak.
Lumpy growth can set off alarms. If a company hits $1.5M ARR mostly in Q4 while Q1 through Q3 barely moved, investors start asking hard questions about whether the engine is working at all.
Capital Efficiency
Growth rate is only part of the picture. Burn matters too. In 2026, efficient growth means strong ARR growth paired with a burn multiple under 1. Put simply, the old “growth at all costs” approach doesn’t carry the same weight anymore.
Revenue Predictability
ARR gets more useful when you split it into new ARR, expansion ARR, and renewal ARR. That gives investors a cleaner view of how steady the business is.
A company with expansion ARR taking up a larger share of total ARR tends to look more predictable than one that depends only on winning new logos. It’s the difference between a bucket you keep refilling and a flywheel that starts helping itself.
Scalability Signal
ARR is not always just MRR × 12. You need to normalize for contract length, billing cadence, and prepayment. Implementation fees, custom work, and services revenue should be reported separately. If those amounts are mixed into ARR, the metric gets inflated and credibility takes a hit.
That kind of definition discipline matters. If ARR is clean, the rest of the GTM model is easier to trust.
Use these ranges as context only. The main test is whether ARR is clearly defined and easy to trace.
| ARR Benchmark | SMB / PLG | Mid-Market / Sales-Led | Enterprise / Vertical SaaS |
|---|---|---|---|
| ARR to raise Series A | $1M–$2M | $2M–$5M | $3M–$8M |
(Source:)
2. Net Revenue Retention (NRR) and Gross Revenue Retention (GRR)
If ARR shows how big the business is, NRR and GRR show whether that revenue base is growing or slipping away. Net Revenue Retention (NRR) includes renewals, expansions, downgrades, and churn for a customer cohort over a set period. The formula is: (Starting ARR + Expansion − Contraction − Churn) ÷ Starting ARR. Gross Revenue Retention (GRR) strips out expansion and looks only at retained revenue. That makes retention the first hard check on whether acquired revenue compounds instead of leaking out.
Repeatability
NRR above 100% means your current customer base is growing without depending only on new customer acquisition. That matters because investors now push for cohort-level retention curves to see whether newer customers perform as well as the early ones. If the curves stay flat, retention holds up over time. If they fall, churn risk is sitting right there in the data.
Stable cohort curves also tell a simple story: the same ICP is still responding to the same GTM motion. That’s what repeatability looks like in practice.
Capital Efficiency
High NRR compounds growth. When NRR is above 120%, the revenue base expands without extra acquisition spend. That’s a strong sign of efficient growth.
Put differently, you’re not paying again and again to replace lost revenue. The base you already won keeps doing more work for you.
Revenue Predictability
Stable GRR gives you a dependable revenue floor, which makes long-range financial modeling far easier. But raw averages can mislead. Break the data out by segment when you present it – SMB and Enterprise customers often retain in very different ways, and blending them can hide where the GTM engine is actually working best.
Blended retention numbers can also cover up weak retention in one segment. That’s the kind of thing investors spot fast, so it’s better to show the split clearly.
Scalability Signal
Use these benchmarks as context, not as a script. If you miss them, explain why by segment and cohort.
| Metric | SMB / PLG | Mid-Market | Enterprise / Vertical SaaS |
|---|---|---|---|
| NRR Target | 100%+ | 108%+ | 115%+ |
| Annual Logo Churn | <10% | <7% | <5% |
| GRR (Annual) | 70–80% | 80–90% | 90%+ |
(Source:)
An NRR below 90% is a major red flag in Series A diligence. It points to a structural product-market fit issue or weak retention. If accounts churned, say what happened, which segment they came from, and what changed in your GTM motion after that. Be specific about churn by segment and cause.
Next, investors test whether that retained revenue was acquired efficiently.
3. Customer Acquisition Cost (CAC)
Customer Acquisition Cost (CAC) is the total cost to win one new customer. Fully loaded CAC includes salaries, commissions, tools, ad spend, and allocated overhead. Investors want that full view because CAC has to survive diligence, not just look good in a pitch deck.
You should track both blended CAC and paid CAC. Investors will push hard on the paid number because it shows what growth costs once new capital goes to work. In plain terms, paid CAC is the number they use when they model post-Series A growth. That’s why CAC becomes the first hard test of whether your growth engine can scale without burning cash too fast.
Capital Efficiency
The key issue is simple: does CAC stay in range as you move from founder-led wins to paid acquisition?
Break CAC out by channel – LinkedIn outbound, content inbound, referrals, and paid search – instead of relying on one blended average. A blended number can hide weak channels. One source may look cheap because another is doing all the heavy lifting.
You also need to split acquisition spend from retention spend. If those costs get mixed together, CAC gets distorted and the unit economics become harder to trust. Once the channel split is clean, the next thing investors look for is whether CAC holds as volume goes up.
Scalability Signal
Rising CAC usually points to channel saturation and weak repeatability. It often means the early wins are gone – founder networks, first-wave referrals, and warm inbound – and the team still hasn’t found channels that keep working as spend climbs.
Big quarter-to-quarter CAC swings create another problem: they make forecasts less believable. If CAC moves around too much, it suggests the GTM motion isn’t producing steady results.
| Segment | Typical CAC Range |
|---|---|
| SMB / PLG | $500–$2,000 |
| Enterprise / Vertical SaaS | $5,000–$15,000+ |
(Source:)
4. CAC Payback Period
CAC Payback Period measures how many months it takes to earn back the cost of winning a new customer from the gross profit that customer produces. The standard formula is fully loaded CAC ÷ monthly gross profit. Use the same fully loaded CAC definition as above. Investors care about gross profit recovery, not top-line revenue. This metric shows whether your go-to-market motion earns back acquisition spend fast enough to support repeatable growth. For Series A investors, it’s one of the quickest ways to judge whether spend can scale without waste.
Capital Efficiency
In 2026, CAC payback is a baseline diligence check, not a bonus. The benchmarks are pretty clear:
| Payback Period | Assessment | Investor Perception |
|---|---|---|
| < 12 months | Excellent | Highly capital-efficient; often commands a valuation premium |
| 12–18 months | Standard | Meets baseline expectations for most Series A raises |
| 18–24 months | Acceptable | Requires strong NRR and high gross margins to justify |
| > 24 months | Risk signal | Suggests the GTM engine needs restructuring before scaling |
This is why payback gets so much attention. If a company spends $1 to win a customer and gets that $1 back in under a year, that same dollar can be put back to work again inside the same funding cycle. If it takes two years or more, growth starts to feel expensive fast.
Revenue Predictability
A short payback period lets a company reinvest the same dollar multiple times within a funding cycle, which reduces the capital required to reach the next milestone. That’s the heart of the metric. It’s not just about efficiency on paper; it’s about whether the business can keep moving without burning too much cash to do it.
A shortening payback period points to improving efficiency. And when payback gets shorter over time, investors get more confidence that the current GTM motion can help fund its own growth.
Scalability Signal
Investors usually model paid CAC payback, not blended payback. That matters. Blended ratios can make performance look better than it is because they pull in low-cost wins like referrals and organic inbound. Paid CAC gives a cleaner view of whether the engine works when you add spend.
You should also exclude professional services revenue from margin math so payback isn’t understated.
Once payback is efficient, investors look at whether that revenue actually sticks.
5. LTV:CAC Ratio
LTV:CAC tells you how much lifetime value you get for every $1 spent on customer acquisition. It’s one of the cleanest ways to test whether CAC is turning into lasting customer value – and whether paid growth is building something that lasts.
The formula investors look for is LTV = (Average Revenue Per Account × Gross Margin %) ÷ Churn Rate. That detail matters. Use gross margin, not top-line revenue, because margin shows how much value is left to recover CAC. For churn, use recent observed churn, not a projected number.
Capital Efficiency
The core test is simple: does customer value clear acquisition cost by a big enough gap?
| Performance Tier | LTV:CAC Ratio | Investor Perception |
|---|---|---|
| Risk Signal | Below 3:1 | Weak unit economics; growth is too expensive |
| Minimum Viable | 3:1 | Baseline for Series A qualification |
| Healthy / Target | 4:1 | Scalable and capital-efficient GTM motion |
| Best-in-class | 5:1+ | Very efficient; supports stronger pricing |
A 3:1 ratio is the floor. It says your model can work. A 4:1 ratio is where the story gets stronger. It shows your GTM motion can scale without burning too much cash.
Revenue Predictability
A rising ratio usually points to better retention or better expansion over time. If you move from 2.5:1 to 4:1 in 12 months, that says a lot. It shows the GTM motion is getting more efficient as it matures, not just getting bigger.
Investors watch that trend closely. They want to see unit economics improve as the motion matures, not stall out once you spend more.
Scalability Signal
Don’t show a blended LTV:CAC number on its own. Break it out by channel and segment so investors can see which motions actually scale. That’s where the signal is.
A blended average can hide problems. One channel may look great while another quietly burns cash. Segment-level ratios show what’s working, what isn’t, and where more spend makes sense.
6. Pipeline Coverage
Pipeline coverage is the ratio of qualified pipeline to your revenue target for a given period. The formula is simple: total qualified pipeline ÷ revenue target. A $2 million target and $8 million in qualified pipeline equals 4x coverage. Investors use this number to check whether the team has enough qualified opportunities to hit plan.
This is one of the earliest signals for next quarter. It tells you whether revenue is already taking shape or whether the team is still hoping deals appear in time.
Series A buyers expect 3x to 5x coverage on the period target. If your sales cycle is longer or your win rate is lower, you’ll often need to stay closer to 5x to absorb normal swings and keep the forecast steady.
Repeatability
Healthy coverage points to a motion that can run without founder-led deals carrying the number. That means your CRM needs clean, standard stages, close dates, and contact history. Spreadsheets make the pipeline harder to inspect and harder to trust.
Revenue Predictability
Coverage only helps predict revenue when stage conversion holds steady for 2 to 3 quarters. Without that, a big pipeline can look better than it is. High pipeline volume is a vanity metric unless it’s paired with stable conversion rates and documented sales velocity.
Show stage conversion next to coverage. That’s what makes the forecast believable.
Scalability Signal
Break coverage down by source and ICP. If all your pipeline comes from one source, that’s a risk. A mix of sources points to a healthier GTM engine and a motion that can scale with less fragility.
Pair coverage with pipeline velocity to show whether deals can move fast enough to close in the period.
Coverage shows how much pipeline exists; conversion rates show how much of it will close.
7. Funnel Conversion Rates
Once you have pipeline, investors want to know one thing: does it move cleanly through the funnel? A single blended close rate won’t cut it. They want stage-by-stage data – Lead to Opportunity, Discovery to Demo, Demo to Proposal, and Proposal to Closed-Won. At Series A, a healthy Proposal-to-Closed-Won rate usually lands around 20% to 30%.
If those conversion rates have held steady or improved across 2 to 3 consecutive quarters, that points to a system you can trust, not a handful of lucky deals. That’s the line between a repeatable GTM motion and founder-led heroics.
Repeatability
Steady conversion by rep and segment is one of the clearest signs that your sales process follows a documented playbook, not personal relationships. If conversion falls off when a non-founder rep takes over, that’s a red flag. It suggests the motion may still lean on founder-driven relationships.
Your CRM should back this up with current stage data, required fields, and contact activity. Not a spreadsheet someone cleaned up the night before the meeting.
Capital Efficiency
When you break conversion rates out by channel, you can see which sources bring in qualified deals and which ones burn budget. Better stage-to-stage conversion means less waste in lead gen and a shorter CAC payback period.
That makes the budget story much easier to tell. If one channel converts better than another, you have a clear case for where capital should go.
Scalability Signal
The main test is simple: do conversion rates hold as volume goes up? If your Lead-to-Opportunity rate stays steady while lead volume climbs, investors will read that as proof your GTM infrastructure can handle growth. If the rate starts to slip, it’s a sign the motion may not scale cleanly and the channel could be getting tapped out.
"Pipeline volume without conversion data is noise. Pipeline velocity – the rate at which pipeline converts to ARR – matters far more than pipeline size alone." – Siddharth Gangal, Founder, Fairview
Break conversion data down by ICP and channel before you present it. That’s where the signal is.
8. Sales Velocity
Sales velocity, sometimes called pipeline velocity, shows how fast qualified pipeline turns into closed revenue. The standard formula is (Number of Opportunities × Average Contract Value × Win Rate%) ÷ Sales Cycle Length. For Series A investors, this metric is a direct read on whether your GTM motion can grow without bogging down. Pipeline coverage tells you if enough deals exist. Velocity tells you if those deals can convert fast enough to matter.
Repeatability
At this stage, the rep-level test is what counts: stable or improving velocity across multiple reps is a strong sign that the sales process is documented and transferable. If velocity holds when a non-founder rep runs the deal, that’s strong proof the motion does not depend on the founder’s network or personal touch.
That distinction matters. A founder can often push deals through by force of will, relationships, or sheer hustle. That’s not scale. Velocity shows whether growth comes from process instead of heroics.
Revenue Predictability
Consistent velocity makes forecasting far less messy. Instead of relying on lumpy quarters or catch-up growth, you can estimate future revenue from current pipeline volume. When you know your average deal size, win rate, and sales cycle length, you can make a grounded call on when pipeline is likely to turn into cash.
For a Series A company, that’s tied straight to burn and runway. If deals close on a steady cadence, planning gets easier. If velocity swings all over the place, the forecast starts to feel more like guesswork.
Scalability Signal
Improving velocity over time can come from a few places: shorter sales cycles, stronger win rates, or more qualified opportunities entering the funnel. Any of those point to a GTM engine that is getting sharper and more efficient.
A trailing 12-month trend is especially useful here. If velocity keeps moving in the right direction over that period, investors can see that the system is maturing rather than stalling after an early spike.
"Investors will pay a premium for a documented, reproducible GTM system that converts a defined ICP through a consistent sales motion." – Meghasyam Pagadala, Founder, TelosVector
Velocity only means something if the funnel data underneath it is clean. Break it out by channel and ICP so you can see which motions close fastest; blended averages tend to blur the picture and hide which deal sizes and segments actually move with speed.
9. Sales Cycle Length
Sales cycle length is the average number of days from the first logged sales contact to a signed contract. The benchmark depends on your segment, so the table below gives the right context. On its own, this number doesn’t say much. It matters when you pair it with conversion rate and deal size, because that’s what ties pipeline activity to actual revenue timing.
Repeatability
When cycle length stays steady – or starts to drop – across reps and segments, it shows the sales process is documented and can be taught across the team.
"At Series A, the sales motion must be repeatable. Average sales cycle documented, ACV established, and conversion rate from lead to close measured." – PitchVault
Revenue Predictability
Sales cycle length is the timing input in your revenue model. If investors know how long deals usually take to close, they can estimate when today’s pipeline is likely to turn into ARR. A long average cycle makes forecast timing less reliable, even if the pipeline looks full on paper.
Scalability Signal
A shorter sales cycle is a sign that the GTM motion is getting more efficient. Don’t show this as a single snapshot. Show the trend across 12 to 18 months. That gives investors a better read on whether the motion is improving or just bouncing around.
You should also break cycle length out by channel and ICP segment. Blended averages can blur the picture and hide what’s working. One motion may be moving fast while another is slowing the whole model down.
| Segment | Sales Cycle Benchmark | Investor Expectation |
|---|---|---|
| SMB / PLG | < 60 days | High velocity, low touch |
| Mid-Market | 30–90 days | Standard B2B SaaS range |
| Enterprise | 90–180+ days | Higher ACV should justify the longer cycle length |
Keep stage, contact history, and expected close date in your CRM. Investors will compare those fields against your forecast. Shorter cycles help with predictability, but deal speed alone isn’t enough. They still want to know whether the contract size supports the sales motion.
10. Average Contract Value (ACV) and Deal Mix
Sales cycle tells you how fast deals close. ACV tells you if those deals are worth doing again.
ACV shows the dollar value of each deal. Deal mix shows whether that revenue comes from a repeatable customer segment or a handful of outliers. Put them together, and investors get a clear read on your GTM motion: is it built on a pattern that can scale, or is it leaning on deals that won’t happen twice?
Repeatability
Consistent ACVs inside a customer cohort usually point to a standard sales process. When deal sizes swing all over the place, that’s often a sign of founder-led selling, custom packaging, or one-off deals instead of a motion you can run again and again.
Stable deal sizes tend to show the motion is maturing. If ACV starts moving up over time, that can mean the company is closing larger contracts.
Capital Efficiency
ACV also helps investors pressure-test CAC and payback for the segment you’re selling into. Concentration risk matters here. It’s a red flag when the top three customers make up more than 30% of revenue, or when any single customer accounts for more than 15% of ARR.
"A company where 60% of ARR comes from a single customer faces concentration risk that complicates Series A valuation." – Siddharth Gangal, Founder, Fairview
Scalability Signal
Don’t stop at blended ACV. Break it out by channel and ICP segment. That split shows investors which paths can repeat and which customer groups drive the most value. The core issue is simple: does revenue come from a few standout deals, or from a steady segment you can keep winning?
| Segment | Typical ACV |
|---|---|
| SMB / PLG | Under $5,000–$10,000 ARR |
| Mid-Market / Sales-Led | $20,000–$50,000 ARR |
| Enterprise / Vertical SaaS | $50,000–$100,000+ ARR |
If ACV lands below the norm for your segment, that can point to weak positioning or poor ICP fit.
Once ACV and deal mix look stable, the next question is whether that revenue sticks.
11. Logo Churn and Revenue Churn
After ACV and deal mix, investors want to see one thing: do customers stay?
That’s what logo churn and revenue churn answer. Logo churn measures the share of customer accounts lost over a set period. Revenue churn measures the revenue lost from cancellations and downgrades before expansion gets added back.
Repeatability
Low logo churn inside a defined ICP is one of the clearest signs that your GTM motion works the same way again and again. If a specific customer segment keeps renewing, investors read that as proof that the product solves a real problem for the right buyer. High logo churn in a segment usually points to a poor ICP match, weak onboarding, or a product that doesn’t keep delivering over time.
The cohort view matters too. If newer cohorts churn faster than older ones, the motion isn’t repeating. Something is breaking as you scale, and investors will spot it fast.
"Logo churn provides a direct signal about product-market fit that revenue metrics can mask." – Siddharth Gangal, Founder, Fairview
Revenue Predictability
GRR is the cleaner floor metric. NRR can make things look better than they are when expansion covers up logo loss. That’s why investors pay close attention to GRR first.
They usually want to see:
- GRR above 85%, with 90%+ seen as ideal
- Monthly revenue churn below 3% for Series A readiness
When churn runs high, the business has to keep replacing lost accounts just to stand still. That makes forecasting harder and puts more pressure on acquisition.
Scalability Signal
The real test isn’t low churn at one moment in time. It’s whether churn stays low as you add reps, channels, and customer segments.
Show churn by segment, channel, and ICP. Blended churn can hide where the motion is leaking. Segment-level churn shows where acquisition is off, where onboarding falls apart, or where the product fit is weaker than expected. Then connect that to the fix you made.
Show what churned, why it churned, and what changed.
12. Forecast Accuracy
After retention, investors want proof that you know what’s likely to close next.
Forecast accuracy measures the gap between what your sales team commits to at the start of a period and what actually closes by the end. At Series A, this tells investors whether your revenue plan runs on discipline or on last-minute surprises.
The math is simple: compare the committed forecast – the deals your team says will close – with actual closed ARR for the month or quarter.
Repeatability
A steady commit-to-close rate across 2 to 3 quarters shows that reps are committing based on stage data, not hope. That matters more than most teams think. If one quarter looks strong and the next falls apart, investors won’t see that as random. They’ll see a sales motion that still leans on gut calls instead of a clear process.
Revenue Predictability
Investors get nervous when quarterly growth is uneven – especially when revenue bunches up at the end and misses the shape they expect to see. This is where CRM discipline stops being admin work and starts affecting the story you can tell.
A clean CRM makes that story believable. Every deal should have a defined stage and an expected close date. Without that, the revenue curve looks accidental instead of controlled.
Scalability Signal
Poor forecast accuracy usually means the number still depends too much on founder-led deals. Investors will look for the usual warning signs:
- repeated close-date slips
- missing stage data
- missing contact history
Forecast accuracy only means something if it holds across reps, channels, and ICPs. That’s the test. Not whether one seller can call a quarter well, but whether the GTM engine keeps working beyond the founders.
Present forecast accuracy using the same definition and time period your CRM uses.
How to Present These Metrics in a Series A Deck or Data Room
Metrics don’t help much when the math shifts from one slide to the next. Clean presentation is what makes the numbers believable. After you lock the definitions, the next job is showing them in a way investors can check and trust.
Use One Definition Per Metric
Every metric in your deck and data room needs a fixed formula, a set date range, and a named owner. Conflicting figures kill trust.
Add a definitions appendix to your data room. Stick to one definition, one owner, and one source of truth. That shows operational discipline before anyone asks the next question.
After definitions, investors look for trends.
Show Current Value, Target, and a 4 to 6 Quarter Trend
Show the current value, the target, and 4 to 6 quarters of history.
Keep formatting consistent across the board. Show ARR, CAC, and ACV in U.S. dollars. Report sales cycle length and CAC payback in days or months. Show conversion rates, NRR, GRR, and logo churn as percentages, and use ratio format for metrics like LTV:CAC.
Annotate any material changes, like pricing, ICP, or channel shifts. If a number moved because the business changed, say so right on the chart.
Then give the slices that explain the result.
Break Down by Channel, ICP, and Customer Size When It Helps
Top-line totals aren’t enough. Investors want segmented data that shows where the GTM engine performs best.
Breaking CAC out by paid versus blended shows how unit economics may change as capital moves into growth channels. NRR by customer segment, such as SMB versus mid-market, can show an expansion motion that the aggregate number hides.
Keep the cuts that change the story. Move the rest to the appendix.
Revenue Infrastructure That Makes These Metrics Credible
A strong pitch deck helps, but it only works if the revenue system underneath it is clean. Metrics don’t earn trust on their own. Systems do. If the data is messy, manual, or hard to trace, the story falls apart the moment an investor starts digging.
Standardize CRM Stages and Required Fields
Every opportunity should include a stage, close date, primary contact, and contact history. When those fields are missing, pipeline coverage gets shaky and forecast accuracy starts to drift.
Spell out what a deal must show before it can move from one stage to the next. A sales playbook keeps stage movement consistent and gives your team something concrete to follow during diligence. Investors will audit the CRM to verify pipeline quality.
That’s the layer underneath pipeline coverage and forecast accuracy.
Automate Attribution and Enrichment
Investors look at source attribution early, and they’ll want to see it tracked over time, not patched together at the last minute. Source attribution should be tracked for at least 9 to 12 months.
Automated enrichment adds firmographic and behavioral detail when a lead is created. That gives you tighter ICP data and cleaner channel CAC. It also cuts down on the manual backtracking that usually shows up during diligence.
That’s what makes CAC and channel mix believable.
Build Auditable Dashboards for Board and Investor Use
Board dashboards need to match monthly management accounts. Every metric on the board slide should tie back to a source system without guesswork.
Build an ARR waterfall that shows starting ARR, new customer ARR, expansion, contraction, churn, and ending ARR each month. Keep 24 months of monthly ARR data ready for diligence. Pair that with cohort retention by acquisition month and CAC by channel.
That’s what makes ARR, retention, and forecast trends hold up in diligence.
Common Mistakes Founders Make When Reporting GTM Metrics
You can clean up the deck. You can tidy the data room. But these reporting mistakes still kill trust fast.
Investors don’t read your metrics in isolation. They check your deck against CRM data, signed contracts, and financial statements. If those numbers don’t line up, the story falls apart.
Mixing ARR, Bookings, and Recognized Revenue
Don’t lump ARR, bookings, and recognized revenue into one number. Keep recurring revenue in ARR, and put services, setup fees, and hardware on separate lines. When you blend them together, the top-line figure looks bigger than it is. Investors will pull it apart during diligence anyway.
If they can’t trace the reported number back to contracts, they’ll discount the whole model.
"Investors who discover that the ARR figure in the deck does not match the calculation from the contract data in the data room will lose confidence in the entire metrics package." – Siddharth Gangal, Founder, Fairview
Multi-year contracts and annual prepayments need to be normalized before you report ARR. If you skip that step, the metric stops being clean and starts looking padded.
That same standard applies to pipeline reporting too.
Using Activity Counts Instead of Qualified Pipeline
Report qualified pipeline, source, and stage conversion. Don’t lead with emails sent, sequences run, or meetings booked.
Activity tells investors your team is busy. Qualified pipeline tells them whether that work can turn into revenue.
Break the pipeline out by:
- Channel
- ICP
- Customer size
Blended funnel totals can hide where the motion works and where it doesn’t. A single rolled-up number may look fine on the surface while one segment is doing all the heavy lifting.
Once the pipeline is cleaned up, investors look for one more thing: whether your math stays the same over time.
Changing Formulas Between Periods
Don’t change your CAC, churn, or payback formulas from quarter to quarter. Pick one method, define the inputs once, and stick with it every period. If the formula changes, the trend line loses meaning.
Be clear about:
- What counts in CAC
- How churn is measured
- What lifetime assumption drives LTV
Add a short definitions appendix in your deck.
This part matters more than many founders think. A metric isn’t just a number. It’s a rule set. If the rule set keeps moving, investors can’t tell whether performance changed or the math did.
Conclusion
A Series A pitch needs to show a repeatable GTM system, not just one strong metric.
ARR growth and NRR show demand and retention. CAC and payback show efficiency. Pipeline coverage and funnel conversion show process. Forecast accuracy shows control. Put it all together, and the main test becomes simple: can this engine keep working at scale?
That’s what investors are pricing. They’re not just looking at your current ARR. They’re judging whether the system behind it can keep running without you personally pushing every deal across the line. Metrics that are clean, defined the same way every time, and tracked over 4 to 6 quarters make that case far better than any story on a slide.
That’s also why presentation matters as much as the numbers. When the deck matches the data room, and every metric is defined the same way, you’re showing investors a GTM system they can underwrite.
FAQs
Which GTM metrics matter most for Series A?
Investors don’t just want growth. They want proof that growth can repeat without the founder personally dragging every deal across the line.
The metrics they watch are pretty clear: ARR growth above 100% year over year, NRR of 110%–120%, CAC payback under 18 months, and an LTV:CAC ratio of at least 3:1.
They also watch the magic number, burn multiple, gross margins, and pipeline velocity. Put together, these show whether the business has a repeatable revenue engine instead of a sales motion held together by founder-led sales.
How many quarters of data should I show investors?
Investors usually want to review the last 12 to 18 months of data. Don’t show a few disconnected snapshots. Show the trend across that full period.
That kind of consistent, trended data helps investors see how the business has changed over time and whether growth and day-to-day execution are becoming more predictable.
How can I make my CRM metrics investor-ready?
Use your CRM as the source of truth for diligence, not just a tool your team updates when they remember. Keep it live, current, and clean. Every deal should have a clear stage, an expected close date, and a complete contact history.
Break out your metrics by channel, product line, and customer type so the numbers tell a clear story. Track deal velocity, match your dashboards to monthly management accounts, and make sure your pipeline isn’t leaning too hard on just one motion. A healthy pipeline shows balance across inbound and outbound sources.